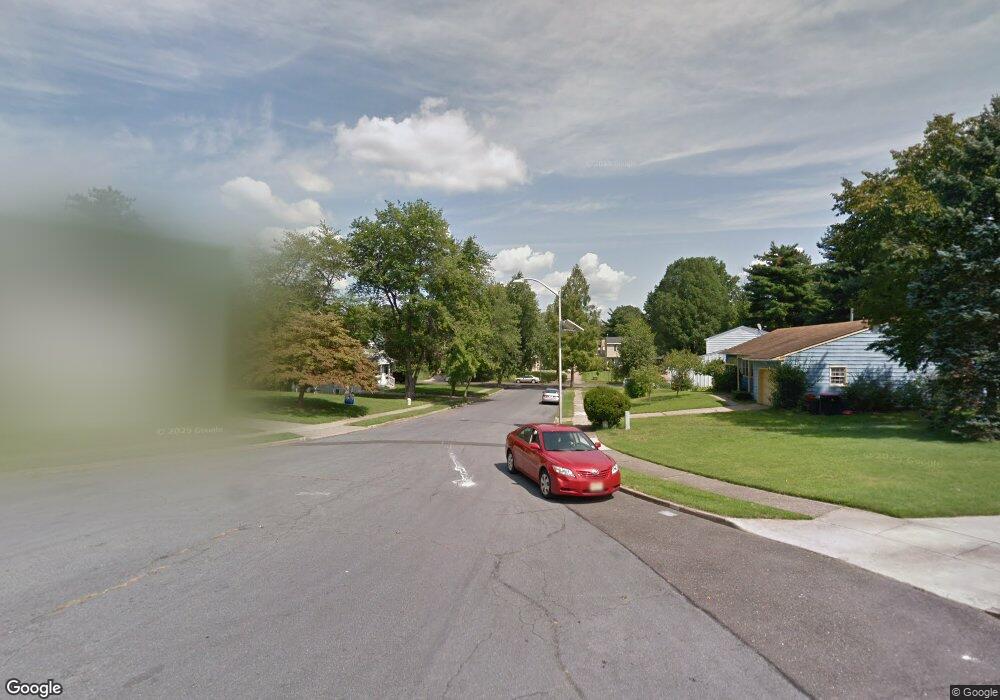
10 Grant Ct Clementon, NJ 08021
Estimated Value: $307,863 - $386,000
Studio
--
Bath
1,416
Sq Ft
$248/Sq Ft
Est. Value
About This Home
This home is located at 10 Grant Ct, Clementon, NJ 08021 and is currently estimated at $351,466, approximately $248 per square foot. 10 Grant Ct is a home located in Camden County with nearby schools including Glen Landing Middle School, Highland Regional High School, and St. Teresa Regional School.
Ownership History
We collect this data history from publicly available records. To have your information removed, we recommend requesting removal directly through your county’s website.
Date
Name
Owned For
Owner Type
Purchase Details
Closed on
Nov 30, 2005
Sold by
Bought by
Current Estimated Value
Home Financials for this Owner
Home Financials are based on the most recent Mortgage that was taken out on this home.
Original Mortgage
$134,010
Outstanding Balance
$74,935
Interest Rate
6.28%
Estimated Equity
$276,531
Purchase Details
Closed on
Aug 16, 1990
Bought by
Create a Home Valuation Report for This Property
The Home Valuation Report is an in-depth analysis detailing your home's value as well as a comparison with similar homes in the area
Home Values in the Area
Average Home Value in this Area
Tax History
We collect this data history from publicly available records. To have your information removed, we recommend requesting removal directly through your county’s website.
| Year | Tax Paid | Tax Assessment Tax Assessment Total Assessment is a certain percentage of the fair market value that is determined by local assessors to be the total taxable value of land and additions on the property. | Land | Improvement |
|---|---|---|---|---|
| 2025 | $8,800 | $200,500 | $61,400 | $139,100 |
| 2024 | $8,363 | $200,500 | $61,400 | $139,100 |
| 2023 | $8,363 | $200,500 | $61,400 | $139,100 |
| 2022 | $8,303 | $200,500 | $61,400 | $139,100 |
| 2021 | $8,098 | $200,500 | $61,400 | $139,100 |
| 2020 | $8,098 | $200,500 | $61,400 | $139,100 |
| 2019 | $7,922 | $200,500 | $61,400 | $139,100 |
| 2018 | $7,890 | $200,500 | $61,400 | $139,100 |
| 2017 | $7,643 | $200,500 | $61,400 | $139,100 |
| 2016 | $7,479 | $200,500 | $61,400 | $139,100 |
| 2015 | $6,951 | $200,500 | $61,400 | $139,100 |
| 2014 | $6,923 | $200,500 | $61,400 | $139,100 |
Source: Public Records
Map
Nearby Homes
Your Personal Tour Guide
Ask me questions while you tour the home.