10 Hatheway Rd Ellington, CT 06029
Estimated Value: $391,331 - $520,000
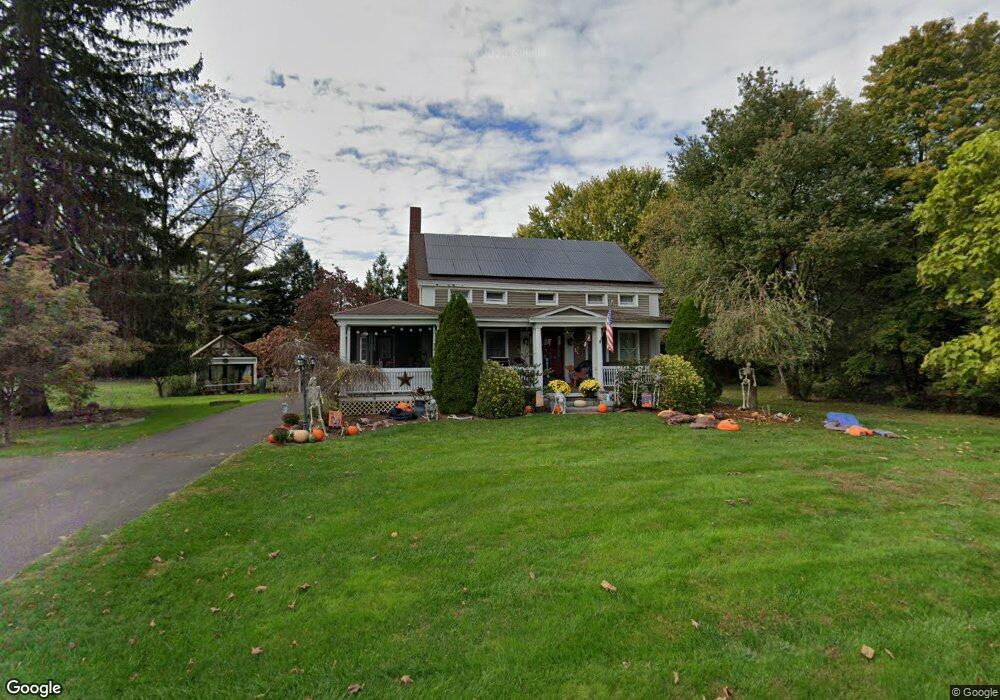
About This Home
This home is located at 10 Hatheway Rd, Ellington, CT 06029 and is currently estimated at $458,333, approximately $279 per square foot. 10 Hatheway Rd is a home located in Tolland County with nearby schools including Ellington High School.
Ownership History
We collect this data history from publicly available records. To have your information removed, we recommend requesting removal directly through your county’s website.
Purchase Details
Home Financials for this Owner
Home Financials are based on the most recent Mortgage that was taken out on this home.Purchase Details
Home Values in the Area
Average Home Value in this Area
Purchase History
We collect this data history from publicly available records. To have your information removed, we recommend requesting removal directly through your county’s website.
| Date | Buyer | Sale Price | Title Company |
|---|---|---|---|
| $60,000 | -- | ||
| $75,000 | -- |
Mortgage History
We collect this data history from publicly available records. To have your information removed, we recommend requesting removal directly through your county’s website.
| Date | Status | Borrower | Loan Amount |
|---|---|---|---|
| Closed | $20,000 | ||
| Closed | $7,000 | ||
| Open | $193,000 |
Tax History
We collect this data history from publicly available records. To have your information removed, we recommend requesting removal directly through your county’s website.
| Year | Tax Paid | Tax Assessment Tax Assessment Total Assessment is a certain percentage of the fair market value that is determined by local assessors to be the total taxable value of land and additions on the property. | Land | Improvement |
|---|---|---|---|---|
| 2025 | $5,500 | $148,250 | $57,900 | $90,350 |
| 2024 | $5,337 | $148,250 | $57,900 | $90,350 |
| 2023 | $5,085 | $148,250 | $57,900 | $90,350 |
| 2022 | $4,818 | $148,250 | $57,900 | $90,350 |
| 2021 | $4,685 | $148,250 | $57,900 | $90,350 |
| 2020 | $4,571 | $140,230 | $58,000 | $82,230 |
| 2019 | $4,571 | $140,230 | $58,000 | $82,230 |
| 2016 | $4,277 | $140,230 | $58,000 | $82,230 |
| 2015 | $4,277 | $140,230 | $58,000 | $82,230 |
| 2014 | $3,966 | $138,180 | $58,000 | $80,180 |
Map
- 96 Muddy Brook Rd
- 22 Sadds Mill Rd
- 11 Benjamin Rd
- 61 Crane Rd
- 58 Maple St
- 215 Pinney St
- 3 Gloria Ln
- 217 West Rd
- 32 Kibbe Rd
- 72 Pinnacle Rd
- 5 Hemlock Dr
- 183 Chamberlain Rd
- 2 Aspen Dr
- 35 Highland Ave
- 0 Porter Rd
- 24 Ellridge Place
- 6 Setting Sun Trail
- 201 Mountain St
- 11 Settlers Way
- 26 Hillside Farms Dr
Ask me questions while you tour the home.