10 Home St Beverly, MA 01915
Downtown Beverly NeighborhoodEstimated Value: $649,000 - $829,522
About This Home
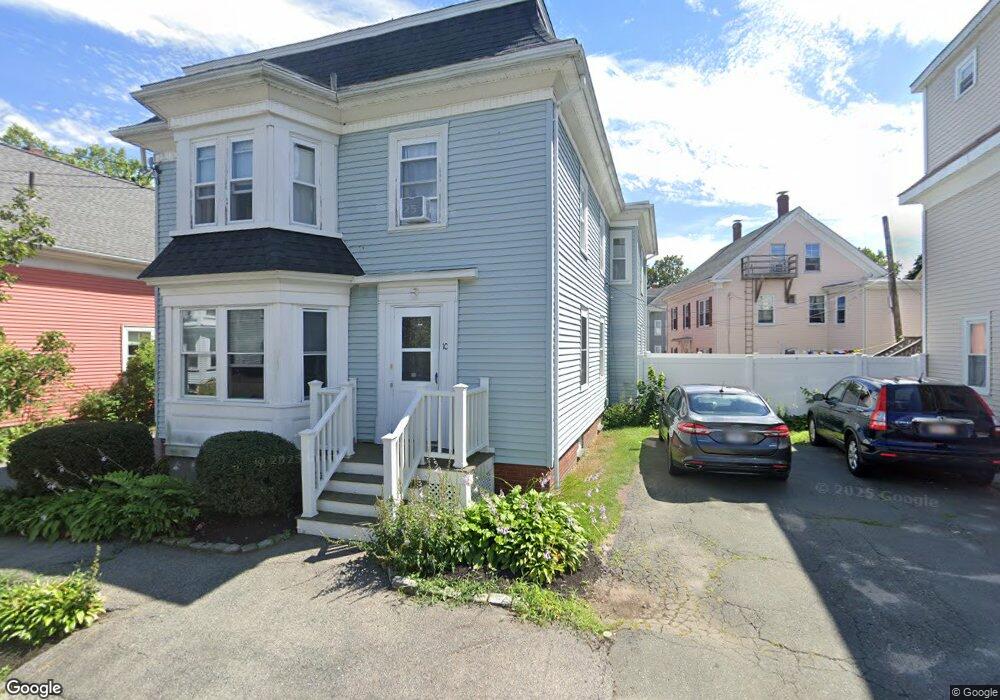
This home is located at 10 Home St, Beverly, MA 01915 and is currently estimated at $764,381, approximately $1,088 per square foot. 10 Home St is a home located in Essex County with nearby schools including Beverly High School, Mrs Alexander's School, and Shore Country Day School.
Ownership History
We collect this data history from publicly available records. To have your information removed, we recommend requesting removal directly through your county’s website.
Purchase Details
Home Financials for this Owner
Home Financials are based on the most recent Mortgage that was taken out on this home.Home Values in the Area
Average Home Value in this Area
Purchase History
We collect this data history from publicly available records. To have your information removed, we recommend requesting removal directly through your county’s website.
| Date | Buyer | Sale Price | Title Company |
|---|---|---|---|
| $140,000 | -- |
Mortgage History
We collect this data history from publicly available records. To have your information removed, we recommend requesting removal directly through your county’s website.
| Date | Status | Borrower | Loan Amount |
|---|---|---|---|
| Open | $150,000 | ||
| Closed | $128,000 | ||
| Closed | $126,000 | ||
| Previous Owner | $48,000 |
Tax History
We collect this data history from publicly available records. To have your information removed, we recommend requesting removal directly through your county’s website.
| Year | Tax Paid | Tax Assessment Tax Assessment Total Assessment is a certain percentage of the fair market value that is determined by local assessors to be the total taxable value of land and additions on the property. | Land | Improvement |
|---|---|---|---|---|
| 2025 | $7,125 | $648,300 | $352,300 | $296,000 |
| 2024 | $6,563 | $584,400 | $288,400 | $296,000 |
| 2022 | $5,915 | $486,000 | $204,400 | $281,600 |
| 2021 | $5,745 | $452,400 | $195,300 | $257,100 |
| 2020 | $5,177 | $432,800 | $179,600 | $253,200 |
| 2019 | $4,381 | $367,300 | $137,200 | $230,100 |
| 2018 | $4,292 | $315,600 | $111,800 | $203,800 |
| 2017 | $4,177 | $292,500 | $82,600 | $209,900 |
| 2016 | $3,872 | $269,100 | $82,600 | $186,500 |
| 2015 | $3,797 | $269,100 | $82,600 | $186,500 |
Map
- 47 Wallis St
- 7 Wallis St
- 348 Rantoul St Unit 202
- 26 Pleasant St
- 8 May St
- 81 Cabot St Unit 1M
- 328 Cabot St
- 47 Elliott St
- 44 Charnock St
- 35 Thorndike St
- 60 Rantoul St Unit 708N
- 60 Rantoul St Unit 114N
- 335 & 335R Cabot St
- 335 Cabot St
- 50 Hale St Unit 50
- 8 Baker Ave
- 32 Ocean St
- 94 Lovett St
- 89 Lothrop St
- 5 Beckford St Unit 3
- 7 Home St Unit Apartment 2R
- 7 Home St Unit Apartment 2F
- 7 Home St Unit Apartment 1R
- 7 Home St
- 5 Home St
- 9 Home St
- 11 Home St
- 6 Home St
- 6 Home St Unit 1
- 6 Home St Unit 2
- 8 Home St
- 30 Federal St
- 13 Home St
- 13 Home St Unit 2
- 13 Home St Unit 3
- 28 Federal St
- 26 Federal St
- 25 Bow St
- 2 Home St
- 24 Federal St Unit 3
Ask me questions while you tour the home.