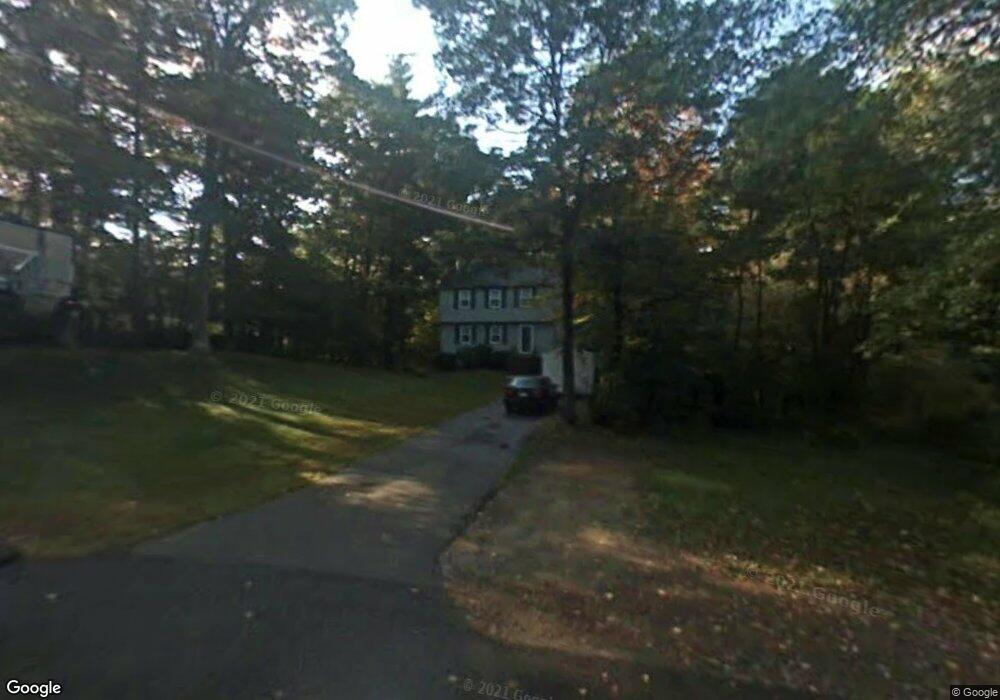
10 Intervale St Wilmington, MA 01887
Estimated Value: $621,922 - $746,000
3
Beds
2
Baths
1,372
Sq Ft
$482/Sq Ft
Est. Value
About This Home
This home is located at 10 Intervale St, Wilmington, MA 01887 and is currently estimated at $661,481, approximately $482 per square foot. 10 Intervale St is a home with nearby schools including Heath-Brook Elementary School, John W. Wynn Middle School, and John F. Ryan Elementary School.
Ownership History
Date
Name
Owned For
Owner Type
Purchase Details
Closed on
Oct 15, 1999
Sold by
Perkins Carol M and Munro David R
Bought by
Camption Mary R
Current Estimated Value
Home Financials for this Owner
Home Financials are based on the most recent Mortgage that was taken out on this home.
Original Mortgage
$304,000
Outstanding Balance
$91,580
Interest Rate
7.8%
Mortgage Type
Purchase Money Mortgage
Estimated Equity
$569,901
Purchase Details
Closed on
Dec 31, 1986
Bought by
Lyons James
Create a Home Valuation Report for This Property
The Home Valuation Report is an in-depth analysis detailing your home's value as well as a comparison with similar homes in the area
Purchase History
| Date | Buyer | Sale Price | Title Company |
|---|---|---|---|
| Camption Mary R | $380,000 | -- | |
| Lyons James | $146,800 | -- |
Source: Public Records
Mortgage History
| Date | Status | Borrower | Loan Amount |
|---|---|---|---|
| Open | Lyons James | $304,000 | |
| Closed | Lyons James | $38,000 |
Source: Public Records
Tax History
| Year | Tax Paid | Tax Assessment Tax Assessment Total Assessment is a certain percentage of the fair market value that is determined by local assessors to be the total taxable value of land and additions on the property. | Land | Improvement |
|---|---|---|---|---|
| 2025 | $5,874 | $513,000 | $216,600 | $296,400 |
| 2024 | $5,761 | $504,000 | $216,600 | $287,400 |
| 2023 | $5,384 | $450,900 | $196,900 | $254,000 |
| 2022 | $5,063 | $388,600 | $164,100 | $224,500 |
| 2021 | $4,978 | $359,700 | $149,200 | $210,500 |
| 2020 | $4,678 | $344,500 | $149,200 | $195,300 |
| 2019 | $4,494 | $326,800 | $142,100 | $184,700 |
| 2018 | $4,356 | $302,300 | $135,300 | $167,000 |
| 2017 | $4,250 | $294,100 | $128,800 | $165,300 |
| 2016 | $3,976 | $271,800 | $122,700 | $149,100 |
| 2015 | $3,835 | $266,900 | $122,700 | $144,200 |
| 2014 | $3,576 | $251,100 | $116,900 | $134,200 |
Source: Public Records
Map
Nearby Homes
Your Personal Tour Guide
Ask me questions while you tour the home.