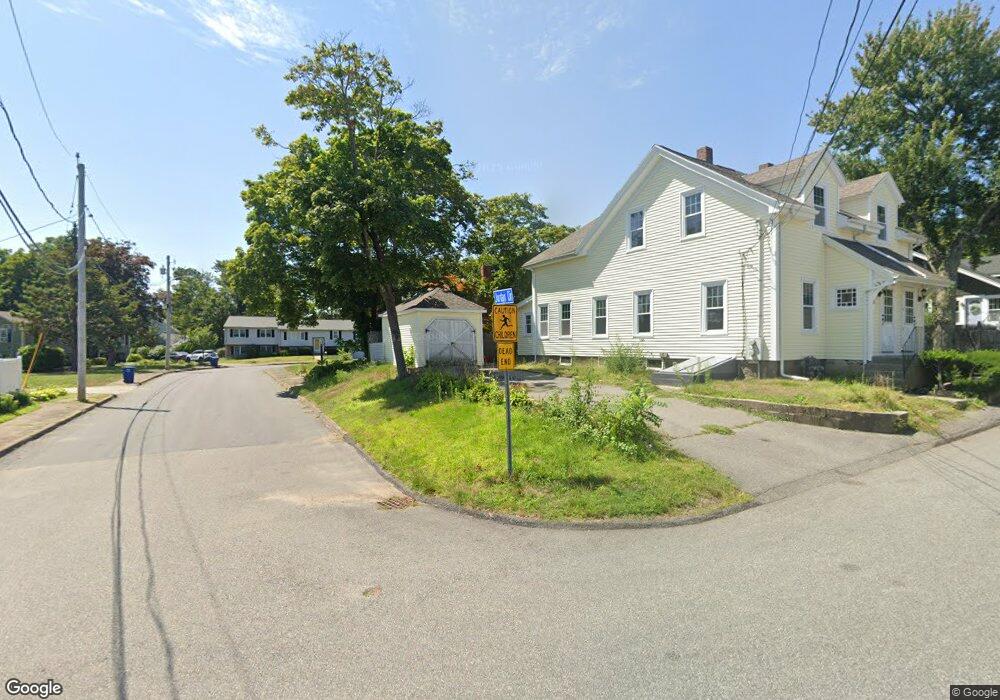
10 Jordan Cir Braintree, MA 02184
East Braintree NeighborhoodEstimated Value: $715,000 - $761,000
3
Beds
3
Baths
1,734
Sq Ft
$424/Sq Ft
Est. Value
About This Home
This home is located at 10 Jordan Cir, Braintree, MA 02184 and is currently estimated at $734,462, approximately $423 per square foot. 10 Jordan Cir is a home located in Norfolk County with nearby schools including Braintree High School, Sacred Heart Elementary School, and South Shore Christian Academy.
Ownership History
Date
Name
Owned For
Owner Type
Purchase Details
Closed on
May 24, 2002
Sold by
Wynacht Ruth M
Bought by
Dirksmeier Joseph A and Dirksmeier Louise L
Current Estimated Value
Home Financials for this Owner
Home Financials are based on the most recent Mortgage that was taken out on this home.
Original Mortgage
$170,000
Outstanding Balance
$72,189
Interest Rate
7.01%
Mortgage Type
Purchase Money Mortgage
Estimated Equity
$662,273
Create a Home Valuation Report for This Property
The Home Valuation Report is an in-depth analysis detailing your home's value as well as a comparison with similar homes in the area
Home Values in the Area
Average Home Value in this Area
Purchase History
| Date | Buyer | Sale Price | Title Company |
|---|---|---|---|
| Dirksmeier Joseph A | $147,000 | -- |
Source: Public Records
Mortgage History
| Date | Status | Borrower | Loan Amount |
|---|---|---|---|
| Open | Dirksmeier Joseph A | $170,000 |
Source: Public Records
Tax History
| Year | Tax Paid | Tax Assessment Tax Assessment Total Assessment is a certain percentage of the fair market value that is determined by local assessors to be the total taxable value of land and additions on the property. | Land | Improvement |
|---|---|---|---|---|
| 2025 | $7,003 | $701,700 | $404,700 | $297,000 |
| 2024 | $6,153 | $649,000 | $367,400 | $281,600 |
| 2023 | $5,822 | $596,500 | $330,200 | $266,300 |
| 2022 | $5,604 | $563,200 | $298,200 | $265,000 |
| 2021 | $5,241 | $526,700 | $269,400 | $257,300 |
| 2020 | $4,953 | $502,300 | $245,000 | $257,300 |
| 2019 | $4,694 | $465,200 | $234,300 | $230,900 |
| 2018 | $4,583 | $434,800 | $213,000 | $221,800 |
| 2017 | $4,440 | $413,400 | $202,400 | $211,000 |
| 2016 | $4,355 | $396,600 | $191,700 | $204,900 |
| 2015 | $4,020 | $363,100 | $159,800 | $203,300 |
| 2014 | $3,826 | $335,000 | $153,400 | $181,600 |
Source: Public Records
Map
Nearby Homes
- 18 Hobart St
- 140 Commercial St
- 41 Lantern Ln
- 54 Edgemont Rd
- 300 Commercial St Unit 23
- 37 Lantern Ln
- 82 Cotton Ave
- 599 Union St
- 14 Hillside Rd
- 87 Arborway Dr
- 67 Trefton Dr
- 25 Richmond St
- 38 Stonewood Ln
- 30 Skyline Dr Unit 6
- 37 Skyline Dr Unit 11
- 149 Glenrose Ave
- 25 W Howard St Unit C3
- 15 Bower Rd Unit F9
- 58 Norma Ave
- 36 Chestnut Ave
- 22 Sheppard Ave
- 20 Sheppard Ave
- 16 Jordan Cir
- 155 Allen St
- 8 Sheppard Ave
- 9 Jordan Cir
- 30 Sheppard Ave Unit A
- 30 Sheppard Ave Unit 32
- 32 Sheppard Ave Unit 32
- 30 Sheppard Ave Unit 30
- 32 Sheppard Ave Unit 2
- 30 Sheppard Ave Unit 1
- 163 Allen St
- 22 Jordan Cir
- 159 Allen St
- 25 Sheppard Ave
- 149 Allen St
- 169 Allen St
- 141 Allen St
- 141 Allen St
Your Personal Tour Guide
Ask me questions while you tour the home.