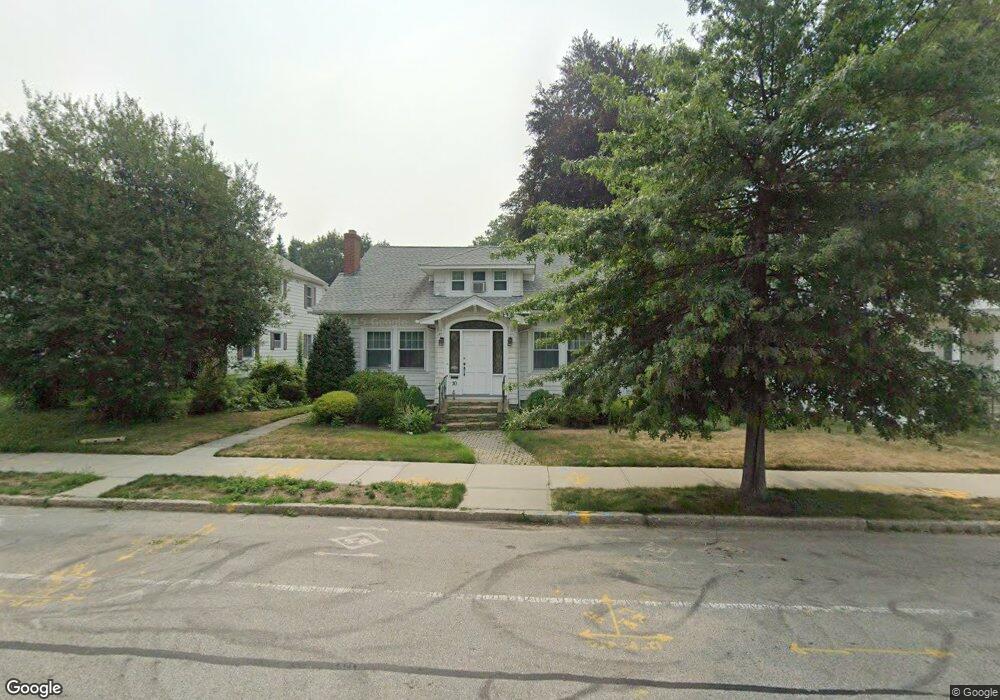
10 June St Unit TER Worcester, MA 01602
Elm Park NeighborhoodEstimated Value: $481,377 - $532,000
4
Beds
1
Bath
1,576
Sq Ft
$318/Sq Ft
Est. Value
About This Home
This home is located at 10 June St Unit TER, Worcester, MA 01602 and is currently estimated at $501,094, approximately $317 per square foot. 10 June St Unit TER is a home located in Worcester County with nearby schools including Chandler Magnet, Jacob Hiatt Magnet School, and Midland Street.
Ownership History
Date
Name
Owned For
Owner Type
Purchase Details
Closed on
Jul 26, 2010
Sold by
Sweeten Kevin and Sweeten Ann Marie
Bought by
Skwisz Diane M
Current Estimated Value
Home Financials for this Owner
Home Financials are based on the most recent Mortgage that was taken out on this home.
Original Mortgage
$189,625
Outstanding Balance
$123,793
Interest Rate
4.76%
Mortgage Type
Purchase Money Mortgage
Estimated Equity
$377,301
Purchase Details
Closed on
Nov 4, 2008
Sold by
Delage Ann Marie and Sweeten Ann Marie
Bought by
Sweeten Ann Marie and Sweeten Kevin
Create a Home Valuation Report for This Property
The Home Valuation Report is an in-depth analysis detailing your home's value as well as a comparison with similar homes in the area
Home Values in the Area
Average Home Value in this Area
Purchase History
| Date | Buyer | Sale Price | Title Company |
|---|---|---|---|
| Skwisz Diane M | $205,000 | -- | |
| Sweeten Ann Marie | -- | -- |
Source: Public Records
Mortgage History
| Date | Status | Borrower | Loan Amount |
|---|---|---|---|
| Open | Skwisz Diane M | $189,625 |
Source: Public Records
Tax History
| Year | Tax Paid | Tax Assessment Tax Assessment Total Assessment is a certain percentage of the fair market value that is determined by local assessors to be the total taxable value of land and additions on the property. | Land | Improvement |
|---|---|---|---|---|
| 2025 | $5,252 | $398,200 | $117,700 | $280,500 |
| 2024 | $5,136 | $373,500 | $117,700 | $255,800 |
| 2023 | $4,949 | $345,100 | $102,400 | $242,700 |
| 2022 | $4,540 | $298,500 | $81,900 | $216,600 |
| 2021 | $4,532 | $278,400 | $65,500 | $212,900 |
| 2020 | $4,434 | $260,800 | $65,500 | $195,300 |
| 2019 | $4,192 | $232,900 | $58,900 | $174,000 |
| 2018 | $4,177 | $220,900 | $58,900 | $162,000 |
| 2017 | $4,034 | $209,900 | $58,900 | $151,000 |
| 2016 | $4,037 | $195,900 | $42,900 | $153,000 |
| 2015 | $3,932 | $195,900 | $42,900 | $153,000 |
| 2014 | $3,677 | $188,200 | $42,900 | $145,300 |
Source: Public Records
Map
Nearby Homes
Your Personal Tour Guide
Ask me questions while you tour the home.