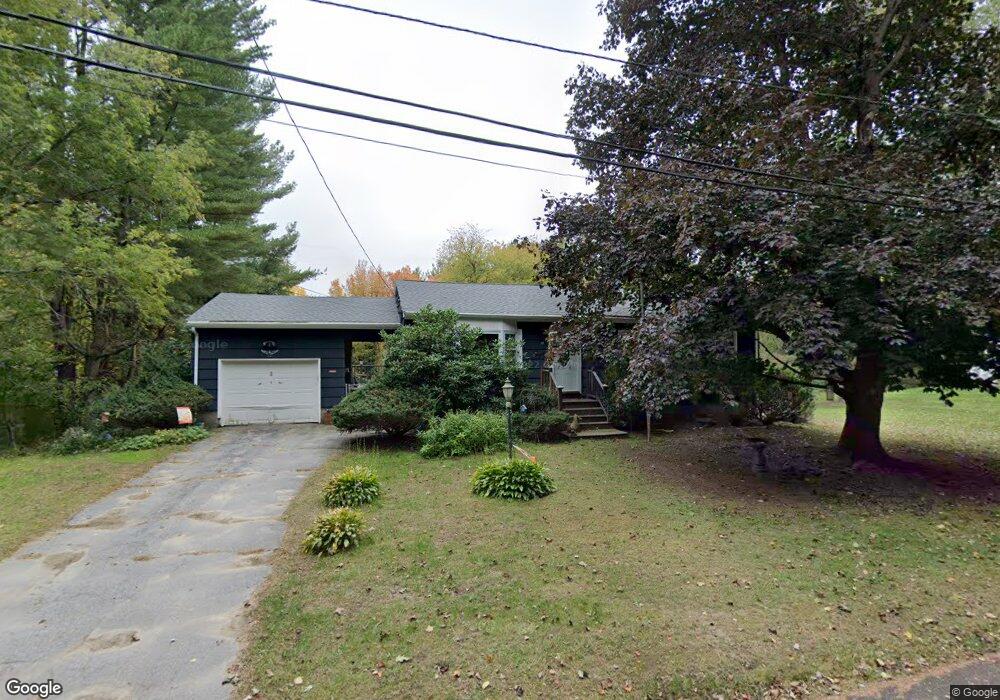
10 Maple St Methuen, MA 01844
The North End NeighborhoodEstimated Value: $500,000 - $548,000
About This Home
This home is located at 10 Maple St, Methuen, MA 01844 and is currently estimated at $529,142, approximately $472 per square foot. 10 Maple St is a home located in Essex County with nearby schools including Methuen High School, Hilltop School, and Saint Monica School.
Ownership History
We collect this data history from publicly available records. To have your information removed, we recommend requesting removal directly through your county’s website.
Purchase Details
Home Financials for this Owner
Home Financials are based on the most recent Mortgage that was taken out on this home.Home Values in the Area
Average Home Value in this Area
Purchase History
We collect this data history from publicly available records. To have your information removed, we recommend requesting removal directly through your county’s website.
| Date | Buyer | Sale Price | Title Company |
|---|---|---|---|
| $112,200 | -- |
Mortgage History
We collect this data history from publicly available records. To have your information removed, we recommend requesting removal directly through your county’s website.
| Date | Status | Borrower | Loan Amount |
|---|---|---|---|
| Open | $56,100 | ||
| Previous Owner | $85,000 |
Tax History
We collect this data history from publicly available records. To have your information removed, we recommend requesting removal directly through your county’s website.
| Year | Tax Paid | Tax Assessment Tax Assessment Total Assessment is a certain percentage of the fair market value that is determined by local assessors to be the total taxable value of land and additions on the property. | Land | Improvement |
|---|---|---|---|---|
| 2025 | $4,973 | $470,000 | $246,000 | $224,000 |
| 2024 | $4,871 | $448,500 | $224,500 | $224,000 |
| 2023 | $4,624 | $395,200 | $199,600 | $195,600 |
| 2022 | $4,425 | $339,100 | $166,500 | $172,600 |
| 2021 | $4,167 | $315,900 | $158,200 | $157,700 |
| 2020 | $4,169 | $310,200 | $158,200 | $152,000 |
| 2019 | $3,915 | $275,900 | $141,600 | $134,300 |
| 2018 | $3,841 | $269,200 | $141,500 | $127,700 |
| 2017 | $3,758 | $256,500 | $141,500 | $115,000 |
| 2016 | $3,591 | $242,500 | $133,300 | $109,200 |
| 2015 | $3,489 | $239,000 | $133,300 | $105,700 |
Map
- 85 Phoebe St Unit 46
- 4 Plover Ln Unit 4
- 11 Hummingbird Way Unit 11
- 7 Hummingbird Way Unit 150
- 38 Phoebe St Unit 102
- 40 Phoebe St Unit 101
- 19 Elane Ave
- 15 Cardinal Rd Unit 15
- 2 Hummingbird Way Unit 1
- 2 Liam's Ln
- 76 Maple St
- 49 Pine Tree Dr Unit 49
- 64 Pine Tree Dr
- 64 Pine Tree Dr Unit 64
- 2 Hitching Post Ln
- 24 Hampstead St
- 36 Mary Lou St
- 4 Olympic Village Dr
- 27 Mary Lou St
- 163 Old Ferry Rd
Ask me questions while you tour the home.