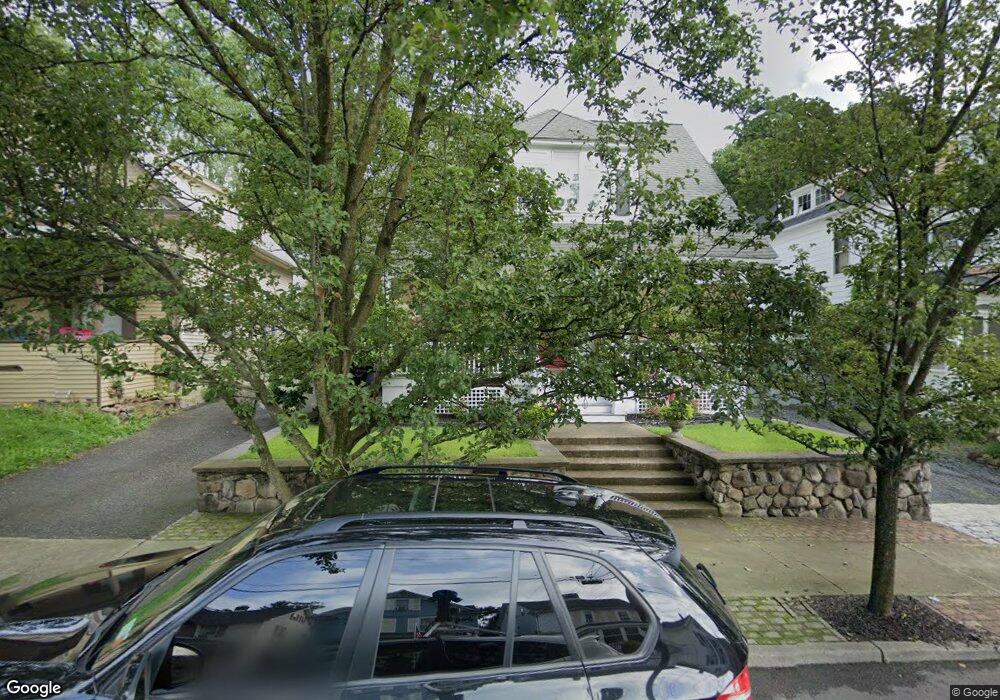
10 Maple St Newburgh, NY 12550
Estimated Value: $313,000 - $347,000
3
Beds
1
Bath
1,224
Sq Ft
$264/Sq Ft
Est. Value
About This Home
This home is located at 10 Maple St, Newburgh, NY 12550 and is currently estimated at $323,268, approximately $264 per square foot. 10 Maple St is a home located in Orange County with nearby schools including Newburgh Free Academy Main Campus, Bishop Dunn Memorial, and Little Harvard.
Ownership History
Date
Name
Owned For
Owner Type
Purchase Details
Closed on
Dec 21, 2009
Sold by
Batista Dillon
Bought by
Batista Dillon
Current Estimated Value
Purchase Details
Closed on
Sep 12, 2005
Sold by
Batista Dillon
Bought by
Batista Dillon
Purchase Details
Closed on
Feb 7, 2002
Sold by
Batista Dillon and Rodriguez Frederico
Bought by
Batista Dillon and Rodriguez Sophia
Home Financials for this Owner
Home Financials are based on the most recent Mortgage that was taken out on this home.
Original Mortgage
$82,565
Interest Rate
7.08%
Purchase Details
Closed on
Dec 16, 1998
Sold by
Rodriguez Frederico and Rodriguez Sophia
Bought by
Rodriguez Frederico and Rodriguez Sophia
Create a Home Valuation Report for This Property
The Home Valuation Report is an in-depth analysis detailing your home's value as well as a comparison with similar homes in the area
Home Values in the Area
Average Home Value in this Area
Purchase History
| Date | Buyer | Sale Price | Title Company |
|---|---|---|---|
| Batista Dillon | -- | Gene L Grobstein | |
| Batista Dillon | -- | Gene L. Grobstein | |
| Batista Dillon | -- | -- | |
| Rodriguez Frederico | -- | -- |
Source: Public Records
Mortgage History
| Date | Status | Borrower | Loan Amount |
|---|---|---|---|
| Previous Owner | Batista Dillon | $82,565 |
Source: Public Records
Tax History
| Year | Tax Paid | Tax Assessment Tax Assessment Total Assessment is a certain percentage of the fair market value that is determined by local assessors to be the total taxable value of land and additions on the property. | Land | Improvement |
|---|---|---|---|---|
| 2024 | $8,693 | $289,300 | $52,900 | $236,400 |
| 2023 | $8,693 | $263,000 | $52,900 | $210,100 |
| 2022 | $8,913 | $208,600 | $22,700 | $185,900 |
| 2021 | $8,107 | $173,800 | $20,600 | $153,200 |
| 2020 | $5,600 | $165,500 | $20,600 | $144,900 |
| 2019 | $2,714 | $115,600 | $20,600 | $95,000 |
| 2018 | $2,714 | $115,600 | $24,900 | $90,700 |
| 2017 | $4,905 | $115,600 | $24,900 | $90,700 |
| 2016 | $5,030 | $116,400 | $24,900 | $91,500 |
| 2015 | -- | $116,400 | $24,900 | $91,500 |
| 2014 | -- | $116,400 | $24,900 | $91,500 |
Source: Public Records
Map
Nearby Homes
Your Personal Tour Guide
Ask me questions while you tour the home.