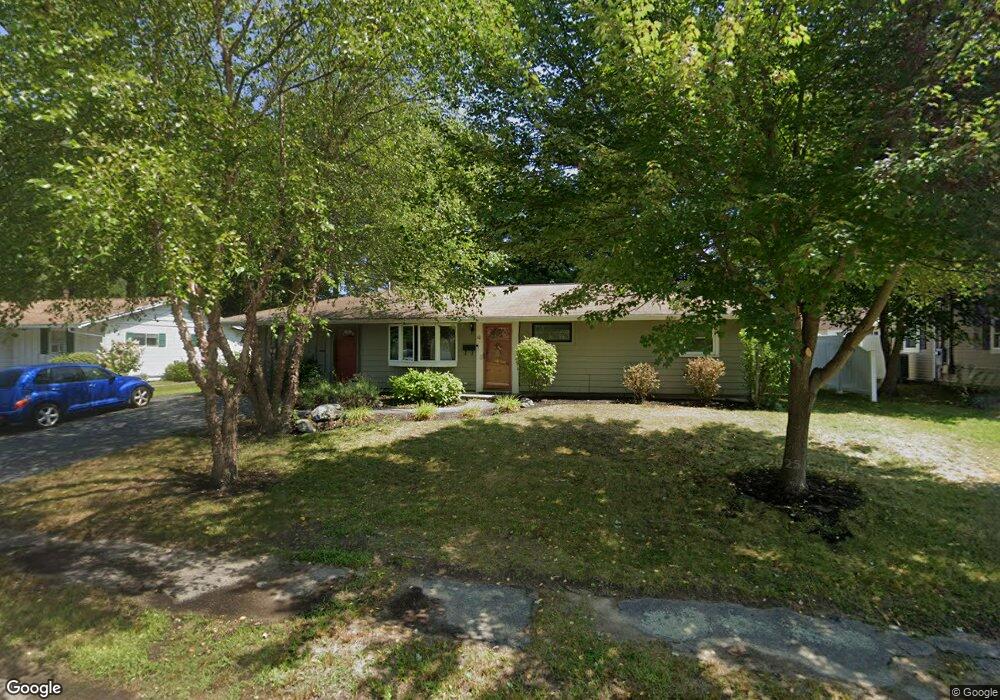
10 Marion St Holbrook, MA 02343
Holbrook AreaEstimated Value: $492,344 - $524,000
About This Home
This home is located at 10 Marion St, Holbrook, MA 02343 and is currently estimated at $509,086, approximately $388 per square foot. 10 Marion St is a home located in Norfolk County with nearby schools including John F. Kennedy Elementary School, Holbrook Middle High School, and Boston Higashi School.
Ownership History
We collect this data history from publicly available records. To have your information removed, we recommend requesting removal directly through your county’s website.
Purchase Details
Home Financials for this Owner
Home Financials are based on the most recent Mortgage that was taken out on this home.Home Values in the Area
Average Home Value in this Area
Purchase History
We collect this data history from publicly available records. To have your information removed, we recommend requesting removal directly through your county’s website.
| Date | Buyer | Sale Price | Title Company |
|---|---|---|---|
| $275,000 | -- |
Mortgage History
We collect this data history from publicly available records. To have your information removed, we recommend requesting removal directly through your county’s website.
| Date | Status | Borrower | Loan Amount |
|---|---|---|---|
| Open | $160,000 | ||
| Closed | $75,000 | ||
| Closed | $55,000 |
Tax History
We collect this data history from publicly available records. To have your information removed, we recommend requesting removal directly through your county’s website.
| Year | Tax Paid | Tax Assessment Tax Assessment Total Assessment is a certain percentage of the fair market value that is determined by local assessors to be the total taxable value of land and additions on the property. | Land | Improvement |
|---|---|---|---|---|
| 2025 | $52 | $391,400 | $228,200 | $163,200 |
| 2024 | $5,090 | $378,700 | $223,200 | $155,500 |
| 2023 | $5,268 | $342,500 | $195,800 | $146,700 |
| 2022 | $5,140 | $311,700 | $186,500 | $125,200 |
| 2021 | $4,932 | $286,400 | $168,000 | $118,400 |
| 2020 | $5,120 | $278,700 | $166,200 | $112,500 |
| 2019 | $4,908 | $252,200 | $145,700 | $106,500 |
| 2018 | $4,909 | $237,500 | $134,900 | $102,600 |
| 2017 | $4,634 | $221,700 | $123,000 | $98,700 |
| 2016 | $4,103 | $208,900 | $116,100 | $92,800 |
| 2015 | $3,763 | $197,200 | $109,100 | $88,100 |
| 2014 | $3,615 | $192,600 | $109,100 | $83,500 |
Map
- 3 Rindone St
- 39 Marion St
- 484 S Franklin St
- 640 Plymouth St
- 27 Morgan Rd
- 42 Fern Rd
- 76 E Shore Rd
- 33 Quincy St
- 627 S Franklin St
- 81 Border Rd
- 74 Sherrick Ave
- 45 Ernest St
- 354 Sycamore St
- 40 Border Rd
- 719 S Franklin St Unit B Block 3
- 719 S Franklin St Unit F Block 3
- 96 Union St
- 148 N Franklin St
- 14 Elm Ave
- 36 Kalmia Rd
Ask me questions while you tour the home.