Estimated Value: $423,813 - $518,000
About This Home
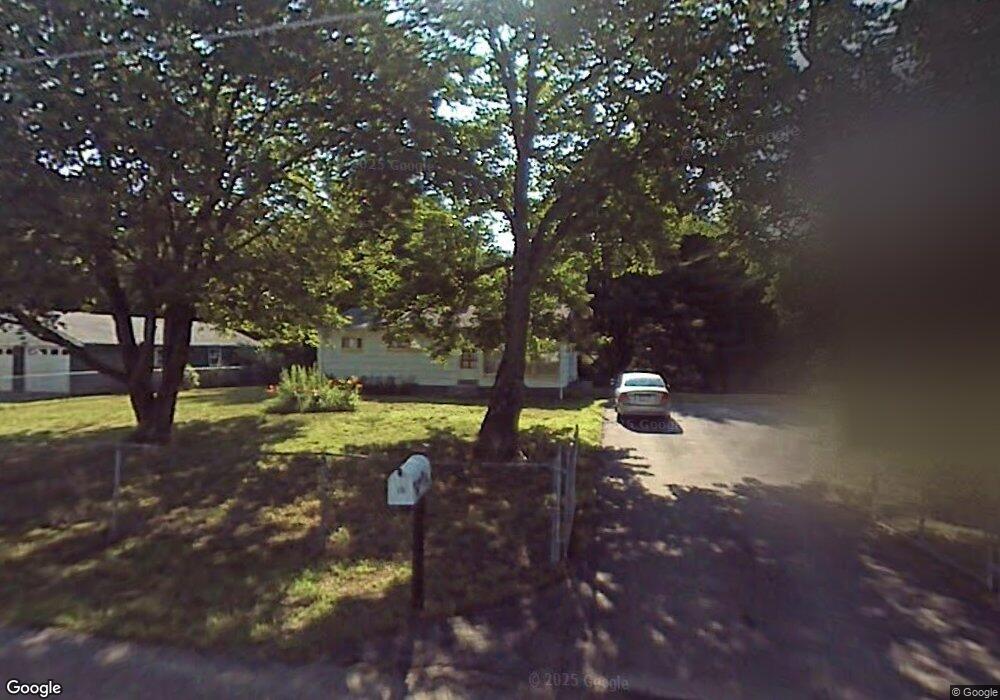
This home is located at 10 Mark St, Ayer, MA 01432 and is currently estimated at $471,703, approximately $491 per square foot. 10 Mark St is a home located in Middlesex County with nearby schools including Page Hilltop School, Lura A. White Elementary School, and Ayer Shirley Regional Middle School.
Ownership History
We collect this data history from publicly available records. To have your information removed, we recommend requesting removal directly through your county’s website.
Purchase Details
Home Financials for this Owner
Home Financials are based on the most recent Mortgage that was taken out on this home.Home Values in the Area
Average Home Value in this Area
Purchase History
We collect this data history from publicly available records. To have your information removed, we recommend requesting removal directly through your county’s website.
| Date | Buyer | Sale Price | Title Company |
|---|---|---|---|
| $98,000 | -- |
Mortgage History
We collect this data history from publicly available records. To have your information removed, we recommend requesting removal directly through your county’s website.
| Date | Status | Borrower | Loan Amount |
|---|---|---|---|
| Closed | $69,600 | ||
| Previous Owner | $70,000 | ||
| Previous Owner | $50,000 |
Tax History
We collect this data history from publicly available records. To have your information removed, we recommend requesting removal directly through your county’s website.
| Year | Tax Paid | Tax Assessment Tax Assessment Total Assessment is a certain percentage of the fair market value that is determined by local assessors to be the total taxable value of land and additions on the property. | Land | Improvement |
|---|---|---|---|---|
| 2025 | $3,826 | $319,900 | $148,800 | $171,100 |
| 2024 | $3,929 | $320,700 | $170,600 | $150,100 |
| 2023 | $3,702 | $298,100 | $159,700 | $138,400 |
| 2022 | $3,568 | $265,900 | $139,300 | $126,600 |
| 2021 | $3,370 | $238,300 | $126,100 | $112,200 |
| 2020 | $3,187 | $226,000 | $121,200 | $104,800 |
| 2019 | $2,936 | $215,400 | $115,600 | $99,800 |
| 2018 | $2,896 | $200,700 | $112,100 | $88,600 |
| 2017 | $2,792 | $194,000 | $108,800 | $85,200 |
| 2016 | $2,678 | $184,300 | $107,700 | $76,600 |
| 2015 | $2,583 | $176,700 | $107,700 | $69,000 |
| 2014 | $2,457 | $174,500 | $107,700 | $66,800 |
Map
- 3 John Riley Rd
- 16 Douglas Dr
- 111 Pleasant St
- 16 Madigan Ln
- 48 Pearl St
- 5 Gaskins Ln
- 0ABC Park St
- 23 Nashua St
- 48 Pleasant St
- 36 Norwood Ave
- 14 Brook St
- 606 Autumn Ridge Dr Unit 606
- 71 W Main St
- 53 Cambridge St
- 46 Central Ave Unit 2
- 57 Shirley St
- 72 Dale Ln
- 124 Central Ave
- 117 Oak Ridge Dr
- 132 Oak Ridge Dr
Ask me questions while you tour the home.