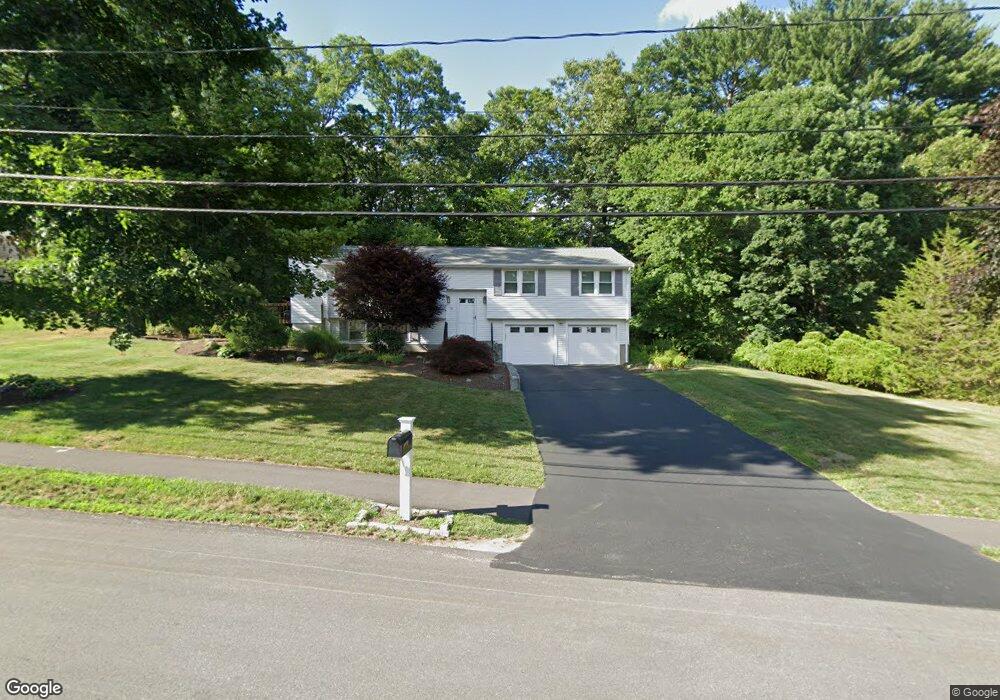
10 Mark St Natick, MA 01760
Estimated Value: $865,000 - $1,200,000
3
Beds
3
Baths
2,002
Sq Ft
$512/Sq Ft
Est. Value
About This Home
This home is located at 10 Mark St, Natick, MA 01760 and is currently estimated at $1,025,206, approximately $512 per square foot. 10 Mark St is a home located in Middlesex County with nearby schools including Natick High School, Bennett-Hemenway (Ben-Hem) Elementary School, and Wilson Middle School.
Ownership History
Date
Name
Owned For
Owner Type
Purchase Details
Closed on
Nov 14, 2008
Sold by
King Scott N
Bought by
King Marcia F
Current Estimated Value
Create a Home Valuation Report for This Property
The Home Valuation Report is an in-depth analysis detailing your home's value as well as a comparison with similar homes in the area
Home Values in the Area
Average Home Value in this Area
Purchase History
| Date | Buyer | Sale Price | Title Company |
|---|---|---|---|
| King Marcia F | -- | -- |
Source: Public Records
Tax History
| Year | Tax Paid | Tax Assessment Tax Assessment Total Assessment is a certain percentage of the fair market value that is determined by local assessors to be the total taxable value of land and additions on the property. | Land | Improvement |
|---|---|---|---|---|
| 2025 | $10,746 | $898,500 | $481,100 | $417,400 |
| 2024 | $10,385 | $847,100 | $454,400 | $392,700 |
| 2023 | $10,128 | $801,300 | $424,800 | $376,500 |
| 2022 | $9,810 | $735,400 | $385,200 | $350,200 |
| 2021 | $9,369 | $688,400 | $364,100 | $324,300 |
| 2020 | $9,153 | $672,500 | $348,200 | $324,300 |
| 2019 | $8,547 | $672,500 | $348,200 | $324,300 |
| 2018 | $8,126 | $622,700 | $316,600 | $306,100 |
| 2017 | $7,912 | $586,500 | $285,700 | $300,800 |
| 2016 | $7,715 | $568,500 | $270,700 | $297,800 |
| 2015 | $7,472 | $540,700 | $270,700 | $270,000 |
Source: Public Records
Map
Nearby Homes
- 8 Liberty St
- 29 Irving Rd
- 14 Drury Ln
- 4 Richard Rd
- 1 Richard Rd
- 25 Irving Rd
- 5 Bradford Rd
- 48 Wethersfield Rd
- 50 Wethersfield Rd
- 37 Longfellow Rd
- 340 N Main St
- 8 Arlington Cir
- 201 Willow Brook Dr
- 26 Longfellow Rd
- 278 N Main St
- 6 Cypress Rd
- 136 Commonwealth Rd
- 6 Ash St
- 6 Briar Ln
- 45 W Plain St Unit 1
Your Personal Tour Guide
Ask me questions while you tour the home.