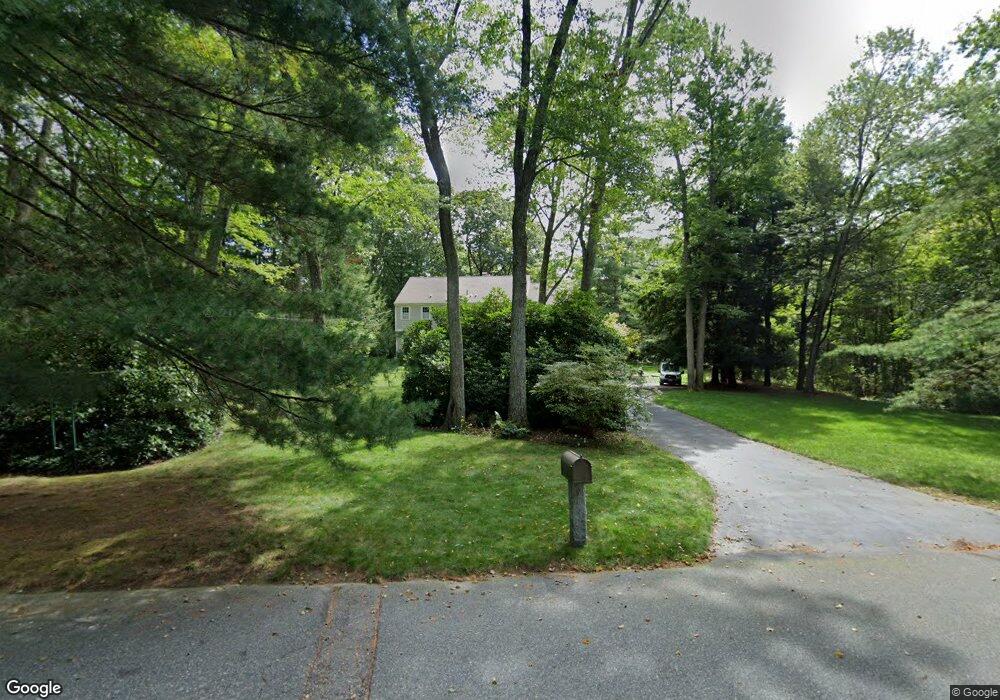
10 Mcgregor Dr Sherborn, MA 01770
Estimated Value: $1,342,514 - $1,725,000
4
Beds
3
Baths
3,010
Sq Ft
$505/Sq Ft
Est. Value
About This Home
This home is located at 10 Mcgregor Dr, Sherborn, MA 01770 and is currently estimated at $1,520,879, approximately $505 per square foot. 10 Mcgregor Dr is a home located in Middlesex County with nearby schools including Pine Hill Elementary School, Dover-Sherborn Regional Middle School, and Dover-Sherborn Regional High School.
Ownership History
Date
Name
Owned For
Owner Type
Purchase Details
Closed on
Jul 16, 2008
Sold by
Junda Jill R and Junda Laurence E
Bought by
Masters Jonathan and Masters Rashel K
Current Estimated Value
Purchase Details
Closed on
Apr 3, 1990
Sold by
Wheeler Stephen H
Bought by
Junda Laurence J
Create a Home Valuation Report for This Property
The Home Valuation Report is an in-depth analysis detailing your home's value as well as a comparison with similar homes in the area
Home Values in the Area
Average Home Value in this Area
Purchase History
| Date | Buyer | Sale Price | Title Company |
|---|---|---|---|
| Masters Jonathan | $828,500 | -- | |
| Junda Laurence J | $399,900 | -- |
Source: Public Records
Mortgage History
| Date | Status | Borrower | Loan Amount |
|---|---|---|---|
| Open | Junda Laurence J | $407,000 | |
| Closed | Junda Laurence J | $410,000 | |
| Closed | Junda Laurence J | $417,000 |
Source: Public Records
Tax History
| Year | Tax Paid | Tax Assessment Tax Assessment Total Assessment is a certain percentage of the fair market value that is determined by local assessors to be the total taxable value of land and additions on the property. | Land | Improvement |
|---|---|---|---|---|
| 2025 | $20,097 | $1,212,100 | $470,500 | $741,600 |
| 2024 | $18,659 | $1,100,800 | $461,800 | $639,000 |
| 2023 | $16,913 | $939,100 | $461,800 | $477,300 |
| 2022 | $15,903 | $835,700 | $450,300 | $385,400 |
| 2021 | $15,818 | $805,800 | $450,300 | $355,500 |
| 2020 | $15,681 | $805,800 | $450,300 | $355,500 |
| 2019 | $15,720 | $801,200 | $450,300 | $350,900 |
| 2018 | $15,241 | $789,700 | $450,300 | $339,400 |
| 2017 | $15,220 | $743,900 | $444,500 | $299,400 |
| 2016 | $14,564 | $708,000 | $415,700 | $292,300 |
| 2015 | $14,238 | $700,700 | $404,100 | $296,600 |
| 2014 | $13,744 | $675,700 | $392,600 | $283,100 |
Source: Public Records
Map
Nearby Homes
- 15 Wildwood Dr
- 90 Maple St
- 9 Adams Ln Unit 9
- 1 Adams Ln Unit 1
- 16 Page Farm Rd
- 84 Old Orchard Rd
- 11 Weld St Unit 33
- 11 Weld St Unit 37
- 11 Weld St Unit 14
- 8 Washington St
- 7 Weld St Unit 50
- 7 Weld St Unit 29
- 147 Washington Street Lot 2
- 363 Eliot St
- 43 Kendall Ave Unit 105
- 54 Tri St
- 15 Bates Rd
- 5 Farm Rd
- 18 Sherborne Cir
- 41 Ivy Ln
Your Personal Tour Guide
Ask me questions while you tour the home.