10 Orchard St Salem, MA 01970
North Salem NeighborhoodEstimated Value: $843,000 - $922,000
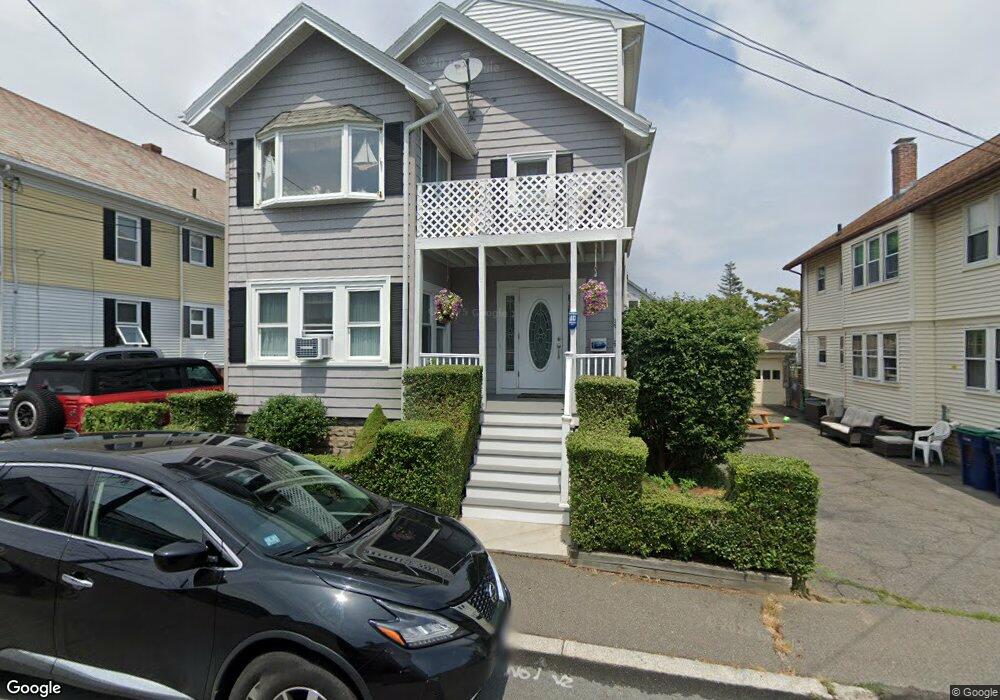
About This Home
This home is located at 10 Orchard St, Salem, MA 01970 and is currently estimated at $878,606, approximately $276 per square foot. 10 Orchard St is a home located in Essex County with nearby schools including Bates Elementary School, Carlton Elementary School, and Saltonstall School.
Ownership History
We collect this data history from publicly available records. To have your information removed, we recommend requesting removal directly through your county’s website.
Purchase Details
Home Values in the Area
Average Home Value in this Area
Purchase History
We collect this data history from publicly available records. To have your information removed, we recommend requesting removal directly through your county’s website.
| Date | Buyer | Sale Price | Title Company |
|---|---|---|---|
| $55,000 | -- |
Mortgage History
We collect this data history from publicly available records. To have your information removed, we recommend requesting removal directly through your county’s website.
| Date | Status | Borrower | Loan Amount |
|---|---|---|---|
| Open | $250,000 | ||
| Closed | $250,000 | ||
| Closed | $50,000 |
Tax History
We collect this data history from publicly available records. To have your information removed, we recommend requesting removal directly through your county’s website.
| Year | Tax Paid | Tax Assessment Tax Assessment Total Assessment is a certain percentage of the fair market value that is determined by local assessors to be the total taxable value of land and additions on the property. | Land | Improvement |
|---|---|---|---|---|
| 2025 | $8,144 | $718,200 | $201,000 | $517,200 |
| 2024 | $7,501 | $645,500 | $191,000 | $454,500 |
| 2023 | $7,222 | $577,300 | $176,300 | $401,000 |
| 2022 | $7,401 | $558,600 | $170,400 | $388,200 |
| 2021 | $7,020 | $508,700 | $158,700 | $350,000 |
| 2020 | $6,894 | $477,100 | $149,900 | $327,200 |
| 2019 | $6,825 | $452,000 | $142,200 | $309,800 |
| 2018 | $6,312 | $410,400 | $135,200 | $275,200 |
| 2017 | $5,897 | $371,800 | $114,000 | $257,800 |
| 2016 | $5,743 | $366,500 | $108,700 | $257,800 |
| 2015 | $5,586 | $340,400 | $99,900 | $240,500 |
Map
- 2 Dearborn St
- 2 Dearborn St Unit C
- 12 1/2 Dearborn St Unit 2
- 10 Osborne St
- 10 Osborne St Unit B
- 16 Franklin St Unit 1502
- 16 Franklin St Unit 1303
- 16 Franklin St Unit 2302
- 16 Franklin St Unit 2401
- 16 Franklin St Unit 2203
- 16 Franklin St Unit 2501
- 112 North St
- 146 North St Unit 4
- 146 North St
- 137 North St Unit 3
- 143 North St Unit 2
- 11 Woodbury Ct
- 9 Lemon St
- 24 Mason St
- 8 Saunders St
Ask me questions while you tour the home.