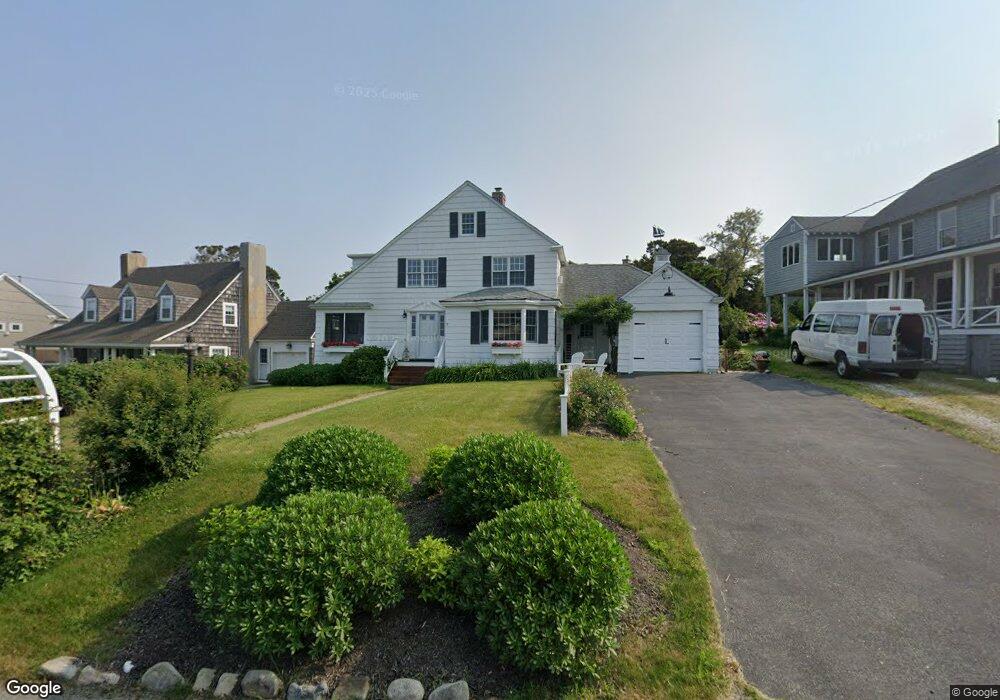
10 Phillips Rd Sagamore Beach, MA 2562
Estimated Value: $823,000 - $958,008
4
Beds
2
Baths
1,722
Sq Ft
$523/Sq Ft
Est. Value
About This Home
This home is located at 10 Phillips Rd, Sagamore Beach, MA 2562 and is currently estimated at $899,752, approximately $522 per square foot. 10 Phillips Rd is a home located in Barnstable County with nearby schools including Bourne High School, Bridgeview Montessori School, and New Testament Christian School.
Ownership History
Date
Name
Owned For
Owner Type
Purchase Details
Closed on
Aug 2, 2021
Sold by
Queenan Stephen P and Riding-Queenan Beverly J
Bought by
Sagamore Beach T and Kennedy
Current Estimated Value
Purchase Details
Closed on
Apr 2, 2019
Sold by
Queenan Helen E Est and Queenan
Bought by
Queenan Stephen P and Riding-Queenan Beverly J
Home Financials for this Owner
Home Financials are based on the most recent Mortgage that was taken out on this home.
Original Mortgage
$258,000
Interest Rate
4.3%
Mortgage Type
New Conventional
Purchase Details
Closed on
Sep 18, 2015
Sold by
Queenan Stephen P and Queenan Arthur W
Bought by
Queenan James F and Queenan Helen E
Purchase Details
Closed on
Mar 16, 2012
Sold by
Papcsy Mary E and Papcsy Allen L
Bought by
Queenan Stephen P and Queenan Arthur W
Purchase Details
Closed on
Jan 11, 2011
Sold by
Queenan James F and Queenan Helen E
Bought by
Papcsy Mary Elizabeth and Queenan Stephen P
Purchase Details
Closed on
Jun 15, 2007
Sold by
Queenan Helen E
Bought by
Queenan Helen E and Queenan James F
Create a Home Valuation Report for This Property
The Home Valuation Report is an in-depth analysis detailing your home's value as well as a comparison with similar homes in the area
Home Values in the Area
Average Home Value in this Area
Purchase History
We collect this data history from publicly available records. To have your information removed, we recommend requesting removal directly through your county’s website.
| Date | Buyer | Sale Price | Title Company |
|---|---|---|---|
| Sagamore Beach T | $730,000 | None Available | |
| Sagamore Beach T | $730,000 | None Available | |
| Queenan Stephen P | $558,000 | -- | |
| Queenan Stephen P | $558,000 | -- | |
| Queenan James F | -- | -- | |
| Queenan James F | -- | -- | |
| Queenan Stephen P | -- | -- | |
| Queenan Stephen P | -- | -- | |
| Queenan Stephen P | -- | -- | |
| Papcsy Mary Elizabeth | -- | -- | |
| Papcsy Mary Elizabeth | -- | -- | |
| Papcsy Mary Elizabeth | -- | -- | |
| Queenan Helen E | -- | -- | |
| Queenan Helen E | -- | -- | |
| Queenan Helen E | -- | -- |
Source: Public Records
Mortgage History
We collect this data history from publicly available records. To have your information removed, we recommend requesting removal directly through your county’s website.
| Date | Status | Borrower | Loan Amount |
|---|---|---|---|
| Previous Owner | Queenan Stephen P | $258,000 |
Source: Public Records
Tax History
| Year | Tax Paid | Tax Assessment Tax Assessment Total Assessment is a certain percentage of the fair market value that is determined by local assessors to be the total taxable value of land and additions on the property. | Land | Improvement |
|---|---|---|---|---|
| 2025 | $7,235 | $926,400 | $626,600 | $299,800 |
| 2024 | $7,075 | $882,200 | $596,700 | $285,500 |
| 2023 | $6,878 | $780,700 | $528,100 | $252,600 |
| 2022 | $6,738 | $667,800 | $467,300 | $200,500 |
| 2021 | $6,545 | $607,700 | $425,300 | $182,400 |
| 2020 | $6,490 | $604,300 | $421,300 | $183,000 |
| 2019 | $6,242 | $593,900 | $421,300 | $172,600 |
| 2018 | $5,918 | $561,500 | $401,300 | $160,200 |
| 2017 | $5,557 | $539,500 | $397,500 | $142,000 |
| 2016 | $5,453 | $536,700 | $397,500 | $139,200 |
| 2015 | $5,405 | $536,700 | $397,500 | $139,200 |
Source: Public Records
Map
Nearby Homes
- 133 Phillips Rd
- 185 Phillips Rd
- 67 Phillips Rd
- 67 Phillips Rd
- 115 Phillips Rd
- 24 Lakewood Rd
- 1 Peaked Cliff Rd
- 16 Ocean Pines Dr Unit A
- 0 State Rd
- 14 Sir Lancelot Dr
- 6 Luigi Ave
- 31 Remington Ln
- 1 Luigi Ave
- 18 Remington Ln
- 3 Lucia Ave
- 53 Pawtuxet Rd
- 18 Gibbs Rd
- 40 Menotomy Rd
- 30 Pawtuxet Rd
- 96 Cliffside Dr Unit 96
- 20 Phillips Rd
- 8 Phillips Rd
- 84 Mayflower Rd
- 2 Phillips Rd
- 28 Phillips Rd
- 28 Phillips Rd
- 21 Phillips Rd
- 11 Phillips Rd
- 78 Mayflower Rd
- 11 Phillips Rd
- 1 Phillips Rd
- 89 Mayflower Rd
- 208 Standish Rd
- 208 Standish Rd Unit WINTER
- 208 Standish Rd Unit WEEKLY
- 7 Holland Rd
- 25 Phillips Rd
- 34 Phillips Rd
- 79 Mayflower Rd
- 9 Holland Rd
Your Personal Tour Guide
Ask me questions while you tour the home.