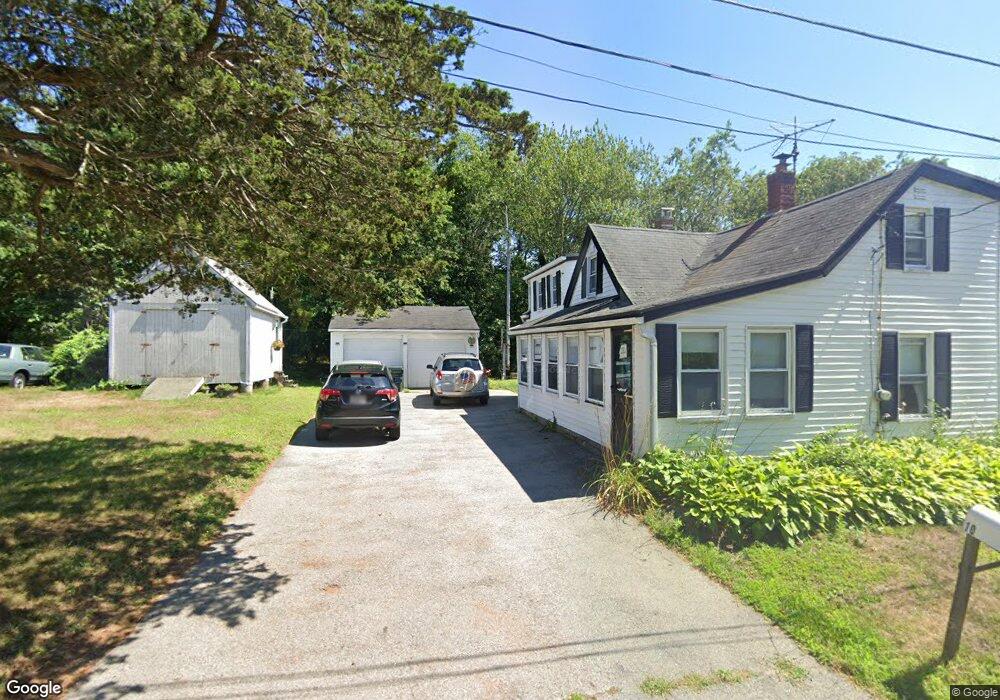
10 Shawmut Ave Danvers, MA 01923
Danvers AreaEstimated Value: $780,102 - $914,000
About This Home
This home is located at 10 Shawmut Ave, Danvers, MA 01923 and is currently estimated at $859,276, approximately $384 per square foot. 10 Shawmut Ave is a home located in Essex County with nearby schools including Danvers High School, St. Mary of the Annunciation School, and Plumfield Academy.
Ownership History
We collect this data history from publicly available records. To have your information removed, we recommend requesting removal directly through your county’s website.
Purchase Details
Home Financials for this Owner
Home Financials are based on the most recent Mortgage that was taken out on this home.Home Values in the Area
Average Home Value in this Area
Purchase History
We collect this data history from publicly available records. To have your information removed, we recommend requesting removal directly through your county’s website.
| Date | Buyer | Sale Price | Title Company |
|---|---|---|---|
| -- | -- |
Mortgage History
We collect this data history from publicly available records. To have your information removed, we recommend requesting removal directly through your county’s website.
| Date | Status | Borrower | Loan Amount |
|---|---|---|---|
| Open | $182,000 | ||
| Closed | $120,000 |
Tax History
We collect this data history from publicly available records. To have your information removed, we recommend requesting removal directly through your county’s website.
| Year | Tax Paid | Tax Assessment Tax Assessment Total Assessment is a certain percentage of the fair market value that is determined by local assessors to be the total taxable value of land and additions on the property. | Land | Improvement |
|---|---|---|---|---|
| 2025 | $5,988 | $544,900 | $389,900 | $155,000 |
| 2024 | $5,987 | $538,900 | $389,900 | $149,000 |
| 2023 | $5,842 | $497,200 | $354,300 | $142,900 |
| 2022 | $5,811 | $459,000 | $321,500 | $137,500 |
| 2021 | $5,519 | $413,400 | $304,500 | $108,900 |
| 2020 | $5,353 | $409,900 | $301,000 | $108,900 |
| 2019 | $5,153 | $388,000 | $273,600 | $114,400 |
| 2018 | $5,091 | $376,000 | $270,900 | $105,100 |
| 2017 | $4,850 | $341,800 | $236,700 | $105,100 |
| 2016 | $4,697 | $330,800 | $225,700 | $105,100 |
| 2015 | $4,463 | $299,300 | $205,200 | $94,100 |
Map
- 98 Newbury St Unit 18B
- 98 Newbury St Unit 2B
- 98 Newbury St Unit 23B
- 96 Newbury St Unit 10B
- 96 Newbury St Unit 9b
- 100 Kirkbride Dr Unit 109
- 6 Briarwood Dr
- 81 Goodale St
- 2 Greystone Dr
- 15 Hilldale Ave
- 9 Preston St
- 14 D'Orlando Way Unit 14
- 6 Donna St
- 13 Mills Point Unit 13
- 11 Nichols Rd
- 261 Newbury St Unit 114C
- 261 Newbury St Unit 1A
- 320 Newbury St Unit 103
- 12 Rita Rd
- 8 Edgewood Rd
Ask me questions while you tour the home.