10 Sheldon Rd Peabody, MA 01960
Peabody Town Center NeighborhoodEstimated Value: $685,000 - $780,000
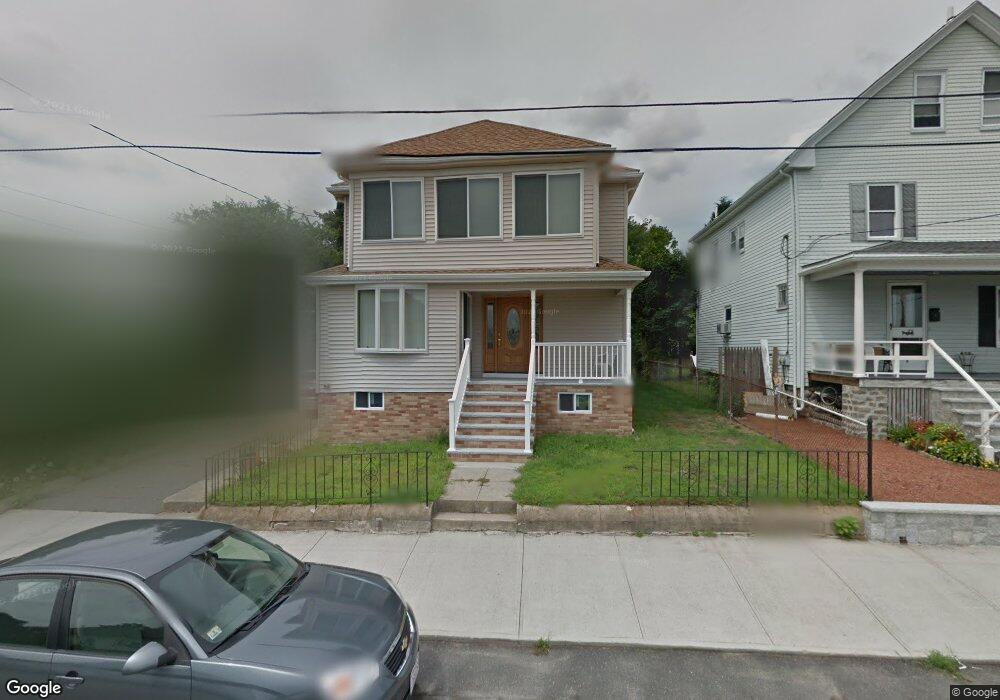
About This Home
This home is located at 10 Sheldon Rd, Peabody, MA 01960 and is currently estimated at $731,515, approximately $386 per square foot. 10 Sheldon Rd is a home located in Essex County with nearby schools including Peabody Veterans Memorial High School, St John The Baptist School, and The Phoenix School.
Ownership History
We collect this data history from publicly available records. To have your information removed, we recommend requesting removal directly through your county’s website.
Purchase Details
Purchase Details
Home Financials for this Owner
Home Financials are based on the most recent Mortgage that was taken out on this home.Home Values in the Area
Average Home Value in this Area
Purchase History
We collect this data history from publicly available records. To have your information removed, we recommend requesting removal directly through your county’s website.
| Date | Buyer | Sale Price | Title Company |
|---|---|---|---|
| -- | -- | ||
| $138,000 | -- |
Mortgage History
We collect this data history from publicly available records. To have your information removed, we recommend requesting removal directly through your county’s website.
| Date | Status | Borrower | Loan Amount |
|---|---|---|---|
| Previous Owner | $90,000 |
Tax History
We collect this data history from publicly available records. To have your information removed, we recommend requesting removal directly through your county’s website.
| Year | Tax Paid | Tax Assessment Tax Assessment Total Assessment is a certain percentage of the fair market value that is determined by local assessors to be the total taxable value of land and additions on the property. | Land | Improvement |
|---|---|---|---|---|
| 2025 | $5,685 | $613,900 | $220,000 | $393,900 |
| 2024 | $5,633 | $617,600 | $220,000 | $397,600 |
| 2023 | $5,216 | $547,900 | $196,500 | $351,400 |
| 2022 | $4,716 | $466,900 | $175,500 | $291,400 |
| 2021 | $4,257 | $405,800 | $159,500 | $246,300 |
| 2020 | $4,411 | $410,700 | $159,500 | $251,200 |
| 2019 | $4,503 | $409,000 | $159,500 | $249,500 |
| 2018 | $3,762 | $328,300 | $145,000 | $183,300 |
| 2017 | $3,655 | $310,800 | $145,000 | $165,800 |
| 2016 | $3,787 | $317,700 | $145,000 | $172,700 |
| 2015 | $3,196 | $259,800 | $141,400 | $118,400 |
Map
- 8 Highland St
- 41 Northend St
- 15 Carol Ann Rd
- 64 Fulton St
- 144 Tremont St
- 44 Paleologos St
- 27 Woodside St
- 18 Balcomb St Unit B
- 18 Balcomb St
- 24 Harris St Unit A
- 181 North St Unit 105
- 31 Symonds St Unit 20
- 57 Buffum St Unit 1
- 75 Walnut St Unit 207
- 46 Walnut St
- 8 Sparrow Ln
- 44 School St Unit 1
- 6 Munroe St
- 42 School St Unit 2
- 8 Pulaski St
- 6 Sheldon Rd
- 8 Sheldon Rd
- 4 Sheldon Rd
- 2 Sheldon Rd
- 6 Kirkland Rd
- 8 Kirkland Rd
- 4 Kirkland Rd
- 10 Kirkland Rd
- 2 Kirkland Rd
- 3 Sheldon Rd
- 11 Walsh Ave
- 1 Sheldon Rd
- 7 Walsh Ave
- 24 Margin St
- 22 Margin St Unit C
- 22 Margin St Unit B
- 22 Margin St Unit A
- 22 Margin St Unit 2
- 22 Margin St Unit 1
- 22 Margin St Unit 3
Ask me questions while you tour the home.