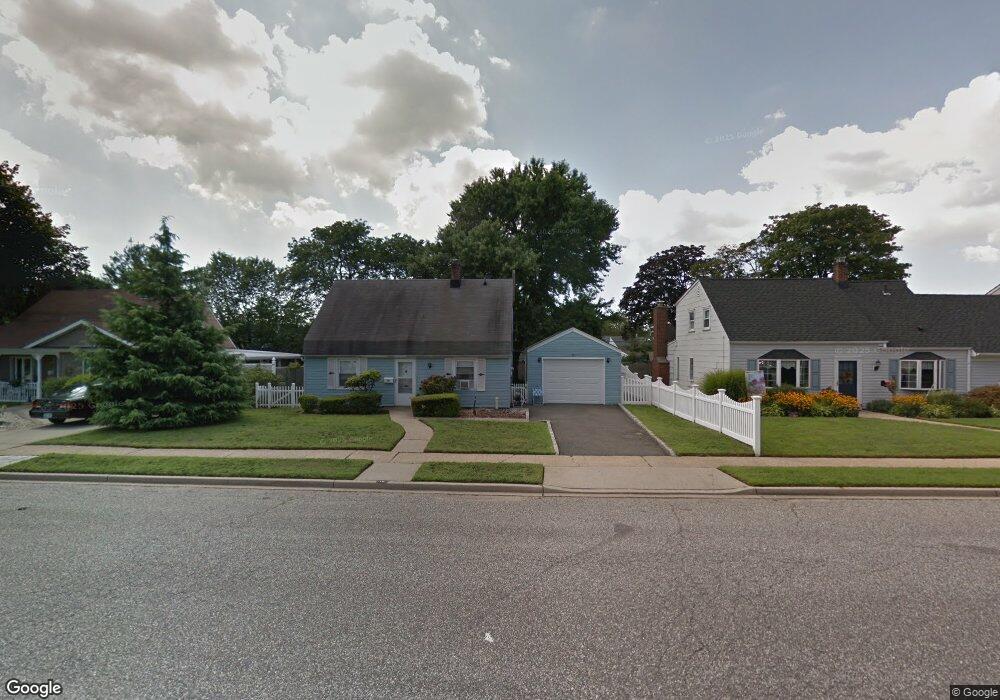
10 Spring Ln Levittown, NY 11756
Estimated Value: $638,000 - $669,800
4
Beds
1
Bath
1,100
Sq Ft
$594/Sq Ft
Est. Value
About This Home
This home is located at 10 Spring Ln, Levittown, NY 11756 and is currently estimated at $653,900, approximately $594 per square foot. 10 Spring Ln is a home located in Nassau County with nearby schools including Gardiners Avenue School, Jonas E. Salk Middle School, and Gen. Douglas MacArthur Senior High School.
Ownership History
Date
Name
Owned For
Owner Type
Purchase Details
Closed on
Oct 11, 2018
Sold by
Dnsk Co Llc
Bought by
Pacheco Juan Pablo and Pacheco Jose
Current Estimated Value
Home Financials for this Owner
Home Financials are based on the most recent Mortgage that was taken out on this home.
Original Mortgage
$363,298
Outstanding Balance
$317,626
Interest Rate
4.62%
Mortgage Type
FHA
Estimated Equity
$336,274
Purchase Details
Closed on
Jul 21, 2015
Sold by
Scalici Carmela and Scalici Christine
Bought by
Dnsk Company Llc
Create a Home Valuation Report for This Property
The Home Valuation Report is an in-depth analysis detailing your home's value as well as a comparison with similar homes in the area
Home Values in the Area
Average Home Value in this Area
Purchase History
| Date | Buyer | Sale Price | Title Company |
|---|---|---|---|
| Pacheco Juan Pablo | $370,000 | None Available | |
| Dnsk Company Llc | $245,000 | None Available |
Source: Public Records
Mortgage History
| Date | Status | Borrower | Loan Amount |
|---|---|---|---|
| Open | Pacheco Juan Pablo | $363,298 |
Source: Public Records
Tax History
| Year | Tax Paid | Tax Assessment Tax Assessment Total Assessment is a certain percentage of the fair market value that is determined by local assessors to be the total taxable value of land and additions on the property. | Land | Improvement |
|---|---|---|---|---|
| 2025 | $12,469 | $382 | $217 | $165 |
| 2024 | $3,062 | $382 | $217 | $165 |
Source: Public Records
Map
Nearby Homes
Your Personal Tour Guide
Ask me questions while you tour the home.