


Highlights
- Basketball Court
- Pool
- Spa
- Walking/Biking Trails
- Grill
- Balcony
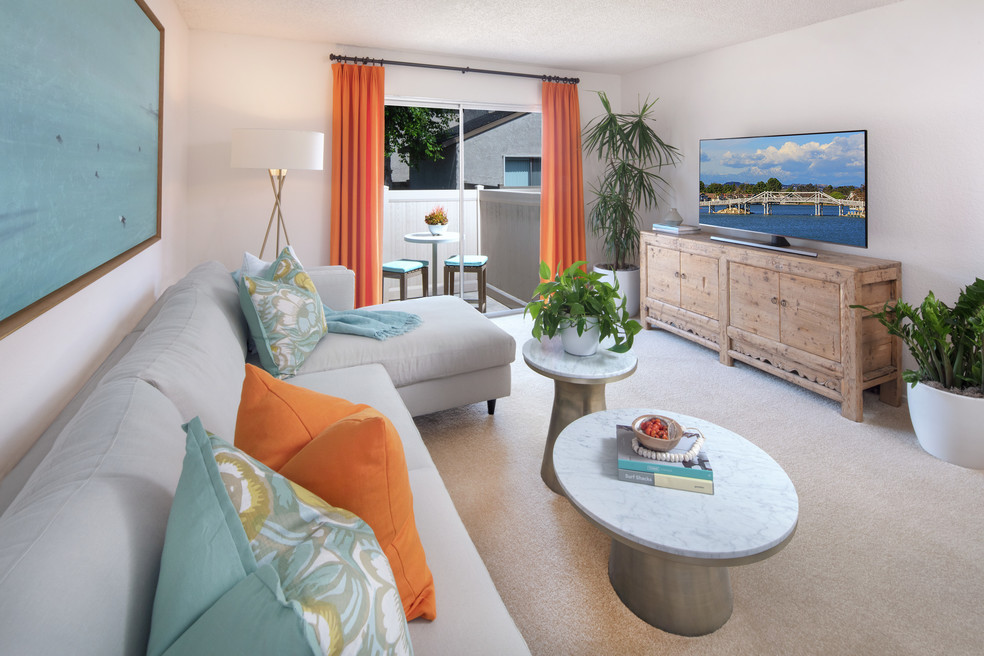
About Woodbridge Villas Apartment Homes
Rental rates, availability, lease terms, deposits, apartment features, amenities, and specials are subject to change without notice. Floor plans and square footages displayed are approximations, may be based on stud-to-stud measurements, and may vary between individual units. Quoted prices are for base rent only and do not include other fees such as application fee (one-time, $45), security deposit (one-time, refundable, amount varies), utility billing fee (not to exceed $5.55/month, Conservice), and utilities (monthly, cost varies). Deposits may fluctuate based on credit, rental history, income, and/or other qualifying standards. Residents are required to obtain and maintain renters insurance (certain exceptions apply). Pricing valid for new residents only, and may vary based on move-in date and lease term. Minimum lease terms and occupancy guidelines may apply. Leasing subject to credit approval, a satisfactory rental application and execution of a lease agreement.

Pricing and Floor Plans
1 Bedroom
Plan Two
$2,550 - $3,570
- 1 Bed
- 1 Bath
- 705 Sq Ft
- $600 deposit
| Unit | Base Price | Sq Ft | Availability | Unit Details |
|---|---|---|---|---|
| F | $2,550 | 705 | Now |
Plan One
$2,580 - $3,615
- 1 Bed
- 1 Bath
- 705 Sq Ft
- $600 deposit
| Unit | Base Price | Sq Ft | Availability | Unit Details |
|---|---|---|---|---|
| C | $2,580 | 705 | Jul 30 | |
| C | $2,580 | 705 | Aug 6 | |
| E | $2,580 | 705 | Aug 18 |
2 Bedrooms
Plan Three
$2,985 - $4,180
- 2 Beds
- 1 Bath
- 853 Sq Ft
- $700 deposit
| Unit | Base Price | Sq Ft | Availability | Unit Details |
|---|---|---|---|---|
| C | $2,985 | 853 | Aug 19 |
Plan Four
$3,950 - $5,530
- 2 Beds
- 2 Baths
- 1,094 Sq Ft
- $700 deposit
| Unit | Base Price | Sq Ft | Availability | Unit Details |
|---|---|---|---|---|
| A | $3,950 | 1,094 | Aug 20 |
3 Bedrooms
Plan Five
$4,015 - $5,625
- 3 Beds
- 2 Baths
- 1,105 Sq Ft
- $800 deposit
| Unit | Base Price | Sq Ft | Availability | Unit Details |
|---|---|---|---|---|
| A | $4,015 | 1,105 | Aug 12 |
Fees and Policies
The fees below are based on community-supplied data and may exclude additional fees and utilities. Use the Rent Estimate Calculator to determine your monthly and one-time costs based on your requirements.
Property Fee Disclaimer: Based on community-supplied data and independent market research. Subject to change without notice. May exclude fees for mandatory or optional services and usage-based utilities.
Community Details
Property Information
- Built in 1982
- 258 units/2 stories
Lease Options
- 6 - 18 Month Leases
Community Amenities
Property Services
- Laundry Facilities
Shared Community
- Lounge
- Walk-Up
Fitness & Recreation
- Fitness Center
- Playground
- Pool
- Spa
- Basketball Court
- Walking/Biking Trails
- Bicycle Storage
Outdoor Features
- Grill
Additional Amenities
- 24hr. emergency maintenance services
- Access to Association amenities
- Access to nearby shopping & dining
- Barbecue grills
- Bike storage
- Bike trail
- Central air conditioning & heat
- Centrally located
- Guest parking available
- Hardwood Style Flooring
- Jogging trail
- Laundry facility on site
- Outdoor basketball court
- Outdoor lounge area
- Park nearby
- Pet friendly
- Reserved covered parking
- Resort-style pool
- Smoke and vape free community
- State-of-the-art fitness center
- Trail nearby
- Ultra-high-speed internet
- Zoned to top-rated schools
Apartment Features
Indoor Features
- Air Conditioning
- High Speed Internet Access
- Smoke Free
Kitchen Features & Appliances
- Microwave
- Refrigerator
Additional Amenities
- Assigned Carport
- Corner/End Location
Matterport 3D Tours
Map
- 20 Wintermist Unit 86
- 42 Almond Tree Ln
- 19 Waterway Unit 9
- 30 Waterway Unit 43
- 17311 Peach
- 3 Willow Tree Ln
- 57 Emerald
- 21 Emerald
- 17294 Citron
- 492 E Yale Loop Unit 9
- 51 Greenmoor
- 17261 Citron
- 11 Redwood Tree Ln
- 54 Willow Tree Ln
- 66 Emerald
- 31 Echo Run Unit 24
- 24 Greenmoor Unit 12
- 13 Firestone Unit 5
- 70 Fairlake Unit 26
- 136 Echo Run Unit 52
- 71 Willow Tree Ln
- 76 Fairlake Unit 23
- 48 Oak Tree Ln
- 204 Greenmoor Unit 90
- 17560 Rosa Drew Ln
- 17 Goldenrod
- 24 Cypress Tree Ln
- 85 Goldenrod
- 18 Rockrose Way
- 5 Rockwood
- 16 Wildwheat Unit 2
- 27 Fallingstar Unit 25
- 28 Timber Run Unit 129
- 22 Creek Rd
- 32 Queens Wreath Way
- 73 Fox Hollow
- 48 Eagle Run
- 5051 Alton Pkwy
- 21 Rustling Wind
- 6 Windjammer
Ask me questions while you tour the home.