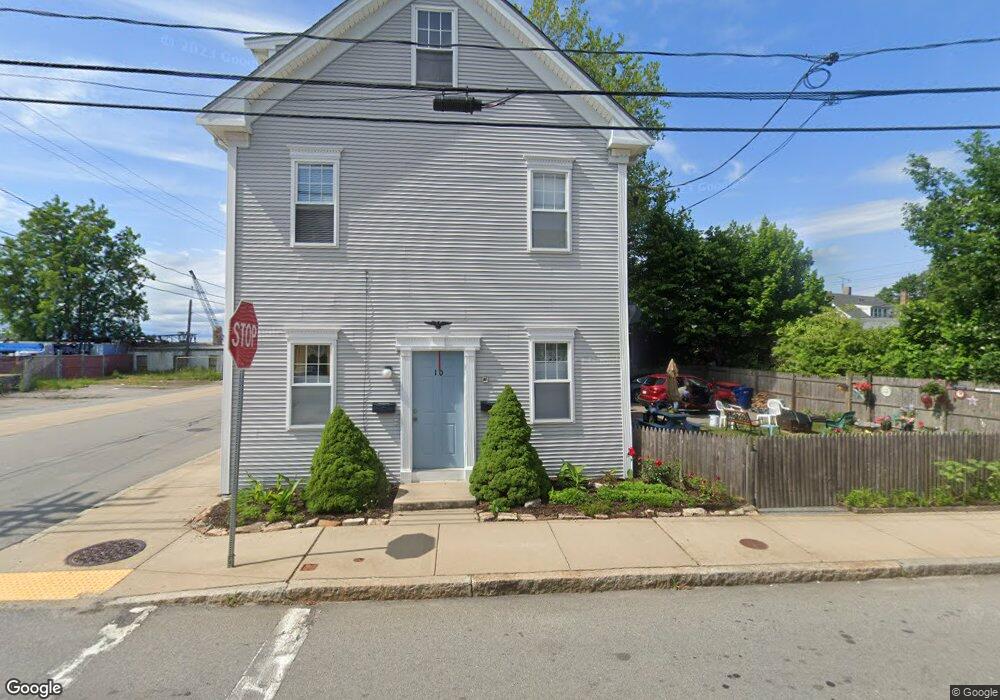
10 Washington St Fairhaven, MA 02719
Estimated Value: $429,000 - $594,000
5
Beds
3
Baths
2,374
Sq Ft
$216/Sq Ft
Est. Value
About This Home
This home is located at 10 Washington St, Fairhaven, MA 02719 and is currently estimated at $513,883, approximately $216 per square foot. 10 Washington St is a home located in Bristol County with nearby schools including Fairhaven High School, City On A Hill Charter Public School New Bedford, and St. Joseph School.
Ownership History
Date
Name
Owned For
Owner Type
Purchase Details
Closed on
Dec 16, 2008
Sold by
Barcellos Jeffrey J
Bought by
Barcellos Jeffrey J and Barcellos Kari
Current Estimated Value
Purchase Details
Closed on
Mar 16, 1995
Sold by
Mendonca Maurice and Mendonca Betty Ann
Bought by
Barcellos Jeffrey J
Create a Home Valuation Report for This Property
The Home Valuation Report is an in-depth analysis detailing your home's value as well as a comparison with similar homes in the area
Home Values in the Area
Average Home Value in this Area
Purchase History
We collect this data history from publicly available records. To have your information removed, we recommend requesting removal directly through your county’s website.
| Date | Buyer | Sale Price | Title Company |
|---|---|---|---|
| Barcellos Jeffrey J | -- | -- | |
| Barcellos Jeffrey J | $32,000 | -- |
Source: Public Records
Mortgage History
We collect this data history from publicly available records. To have your information removed, we recommend requesting removal directly through your county’s website.
| Date | Status | Borrower | Loan Amount |
|---|---|---|---|
| Previous Owner | Barcellos Jeffrey J | $140,000 | |
| Previous Owner | Barcellos Jeffrey J | $128,000 | |
| Previous Owner | Barcellos Jeffrey J | $110,000 |
Source: Public Records
Tax History
| Year | Tax Paid | Tax Assessment Tax Assessment Total Assessment is a certain percentage of the fair market value that is determined by local assessors to be the total taxable value of land and additions on the property. | Land | Improvement |
|---|---|---|---|---|
| 2025 | $39 | $418,500 | $135,800 | $282,700 |
| 2024 | $3,886 | $421,000 | $135,800 | $285,200 |
| 2023 | $3,769 | $378,800 | $114,900 | $263,900 |
| 2022 | $3,582 | $350,500 | $104,400 | $246,100 |
| 2021 | $3,545 | $314,000 | $94,000 | $220,000 |
| 2020 | $3,415 | $308,800 | $88,800 | $220,000 |
| 2019 | $3,691 | $316,300 | $88,800 | $227,500 |
| 2018 | $3,500 | $297,900 | $84,900 | $213,000 |
| 2017 | $3,288 | $273,100 | $79,600 | $193,500 |
| 2016 | $3,099 | $254,400 | $78,300 | $176,100 |
| 2015 | $2,922 | $240,500 | $78,300 | $162,200 |
Source: Public Records
Map
Nearby Homes
- 8 Washington St
- 8 Washington St
- 58 Washington St
- 101 Green St
- 59 Bridge St
- 138 Main St Unit 13
- lot 1 173 Spring St
- 2 Washburn Ave
- 181 Manor Drive Lot 8x
- 181 Manor Drive Lot B
- 181 Washington St
- 0 Morey Ln
- 30 Centre St Unit 2
- 192 Walnut St
- 393 Pleasant St
- 108 School St
- O N St (Ss)
- 5 Tallman Ln
- 60 Mechanics Ln
- 15 Shirley St
Your Personal Tour Guide
Ask me questions while you tour the home.