Estimated Value: $871,000 - $973,000
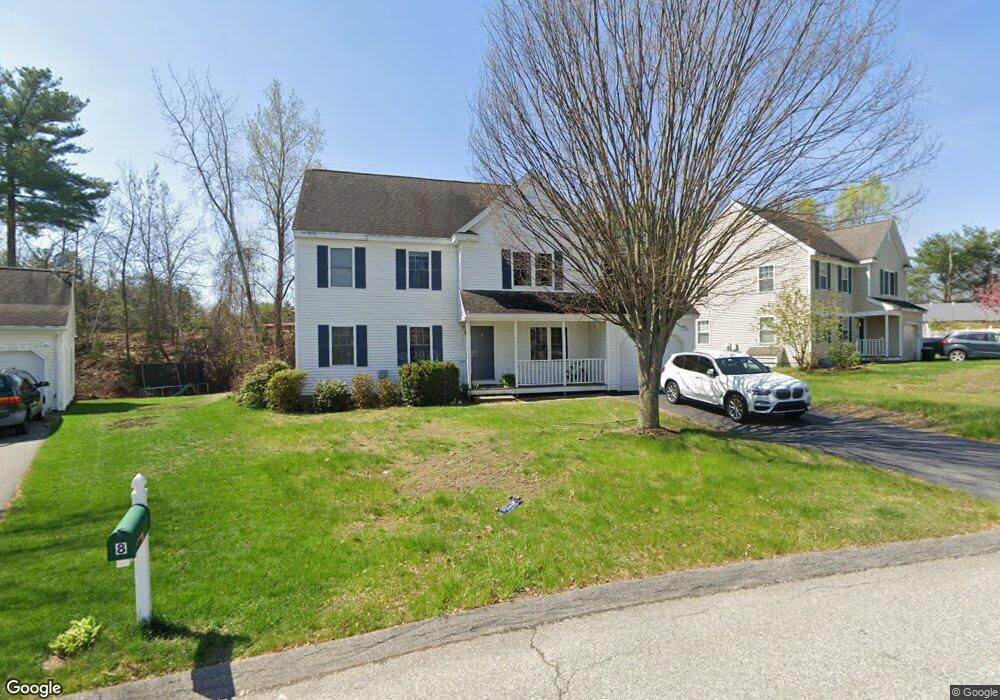
About This Home
Heat and hot water included
Laundry in building
Ownership History
We collect this data history from publicly available records. To have your information removed, we recommend requesting removal directly through your county’s website.
Purchase Details
Home Financials for this Owner
Home Financials are based on the most recent Mortgage that was taken out on this home.Home Values in the Area
Average Home Value in this Area
Purchase History
We collect this data history from publicly available records. To have your information removed, we recommend requesting removal directly through your county’s website.
| Date | Buyer | Sale Price | Title Company |
|---|---|---|---|
| $366,200 | -- |
Mortgage History
We collect this data history from publicly available records. To have your information removed, we recommend requesting removal directly through your county’s website.
| Date | Status | Borrower | Loan Amount |
|---|---|---|---|
| Open | $179,400 | ||
| Closed | $250,000 | ||
| Closed | $329,580 |
Property History
We collect this data history from publicly available records. To have your information removed, we recommend requesting removal directly through your county’s website.
| Date | Event | Price | List to Sale | Price per Sq Ft |
|---|---|---|---|---|
| 10/12/2024 10/12/24 | Off Market | $4,000 | -- | -- |
| 09/26/2024 09/26/24 | For Rent | $4,000 | -- | -- |
Tax History
We collect this data history from publicly available records. To have your information removed, we recommend requesting removal directly through your county’s website.
| Year | Tax Paid | Tax Assessment Tax Assessment Total Assessment is a certain percentage of the fair market value that is determined by local assessors to be the total taxable value of land and additions on the property. | Land | Improvement |
|---|---|---|---|---|
| 2025 | $13,545 | $789,800 | $303,100 | $486,700 |
| 2024 | $12,648 | $758,700 | $303,100 | $455,600 |
| 2023 | $12,515 | $712,700 | $275,500 | $437,200 |
| 2022 | $11,831 | $608,300 | $239,600 | $368,700 |
| 2021 | $11,551 | $571,000 | $221,900 | $349,100 |
| 2020 | $10,892 | $566,100 | $221,900 | $344,200 |
| 2019 | $10,466 | $540,300 | $221,900 | $318,400 |
| 2018 | $10,277 | $530,300 | $221,900 | $308,400 |
| 2017 | $10,012 | $525,300 | $221,900 | $303,400 |
| 2016 | $9,811 | $510,200 | $221,900 | $288,300 |
| 2015 | $9,685 | $508,400 | $221,900 | $286,500 |
| 2014 | $9,344 | $480,400 | $221,900 | $258,500 |
Map
- 24 Deer Path Unit 6
- 39 Adams St
- 70 Powder Mill Rd
- 11 Ethelyn Cir
- 62 Waltham St
- 22 Douglas Ave Unit 2
- 26 Powder Mill Rd
- 4 Oak Ridge Dr Unit 6
- 16 Maybury Rd
- 80 Concord St
- 149 Maynard Farm Rd
- 8 Tremont St
- 26 Tremont St
- 128 Parker St Unit 3C
- 128 Parker St Unit 2C
- 15 Meetinghouse Rd
- 114 Hunters Ridge Rd
- 2 Everett St
- 2 Dartmouth Ct Unit 2
- 120 Parker St Unit 15
Ask me questions while you tour the home.