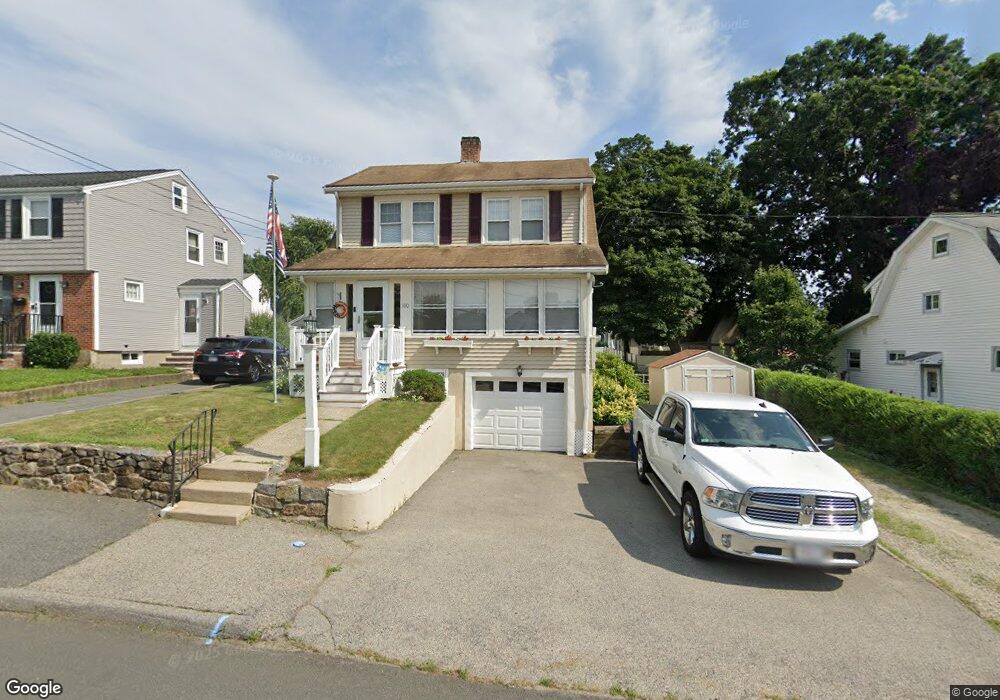
100 Bickford Rd Braintree, MA 02184
East Braintree NeighborhoodEstimated Value: $568,000 - $627,000
3
Beds
2
Baths
1,210
Sq Ft
$492/Sq Ft
Est. Value
About This Home
This home is located at 100 Bickford Rd, Braintree, MA 02184 and is currently estimated at $595,676, approximately $492 per square foot. 100 Bickford Rd is a home located in Norfolk County with nearby schools including Braintree High School, Sacred Heart Elementary School, and South Shore Christian Academy.
Ownership History
Date
Name
Owned For
Owner Type
Purchase Details
Closed on
Jun 30, 1986
Bought by
Allison Mark R and Allison Donna M
Current Estimated Value
Create a Home Valuation Report for This Property
The Home Valuation Report is an in-depth analysis detailing your home's value as well as a comparison with similar homes in the area
Home Values in the Area
Average Home Value in this Area
Purchase History
| Date | Buyer | Sale Price | Title Company |
|---|---|---|---|
| Allison Mark R | $130,000 | -- |
Source: Public Records
Mortgage History
| Date | Status | Borrower | Loan Amount |
|---|---|---|---|
| Open | Allison Mark R | $35,000 | |
| Closed | Allison Mark R | $18,000 |
Source: Public Records
Tax History
| Year | Tax Paid | Tax Assessment Tax Assessment Total Assessment is a certain percentage of the fair market value that is determined by local assessors to be the total taxable value of land and additions on the property. | Land | Improvement |
|---|---|---|---|---|
| 2025 | $5,483 | $549,400 | $322,200 | $227,200 |
| 2024 | $4,956 | $522,800 | $300,500 | $222,300 |
| 2023 | $4,690 | $480,500 | $270,000 | $210,500 |
| 2022 | $4,521 | $454,400 | $243,900 | $210,500 |
| 2021 | $4,169 | $419,000 | $220,300 | $198,700 |
| 2020 | $3,853 | $390,800 | $200,300 | $190,500 |
| 2019 | $3,719 | $368,600 | $191,600 | $177,000 |
| 2018 | $3,627 | $344,100 | $174,200 | $169,900 |
| 2017 | $3,501 | $326,000 | $165,500 | $160,500 |
| 2016 | $3,219 | $293,200 | $139,300 | $153,900 |
| 2015 | $3,168 | $286,200 | $137,600 | $148,600 |
| 2014 | $3,008 | $263,400 | $125,400 | $138,000 |
Source: Public Records
Map
Nearby Homes
- 54 Edgemont Rd
- 82 Cotton Ave
- 18 Hobart St
- 140 Commercial St
- 67 Trefton Dr
- 87 Arborway Dr
- 41 Lantern Ln
- 37 Lantern Ln
- 300 Commercial St Unit 23
- 149 Glenrose Ave
- 30 Skyline Dr Unit 6
- 37 Skyline Dr Unit 11
- 599 Union St
- 25 Richmond St
- 14 Hillside Rd
- 25 W Howard St Unit C3
- 15 Bower Rd Unit F9
- 38 Stonewood Ln
- 80 Manzanetta Ave
- 86 E Howard St Unit 107
- 104 Bickford Rd
- 94 Bickford Rd
- 93 Edgemont Rd
- 90 Bickford Rd
- 97 Edgemont Rd
- 89 Edgemont Rd
- 95 Bickford Rd
- 99 Edgemont Rd
- 89 Bickford Rd
- 105 Bickford Rd
- 105 Bickford Rd Unit 1
- 88 Bickford Rd
- 87 Bickford Rd
- 101 Edgemont Rd
- 79 Edgemont Rd
- 29 Newton St
- 23 Newton St
- 17 Newton St
- 107 Edgemont Rd
- 77 Edgemont Rd
Your Personal Tour Guide
Ask me questions while you tour the home.