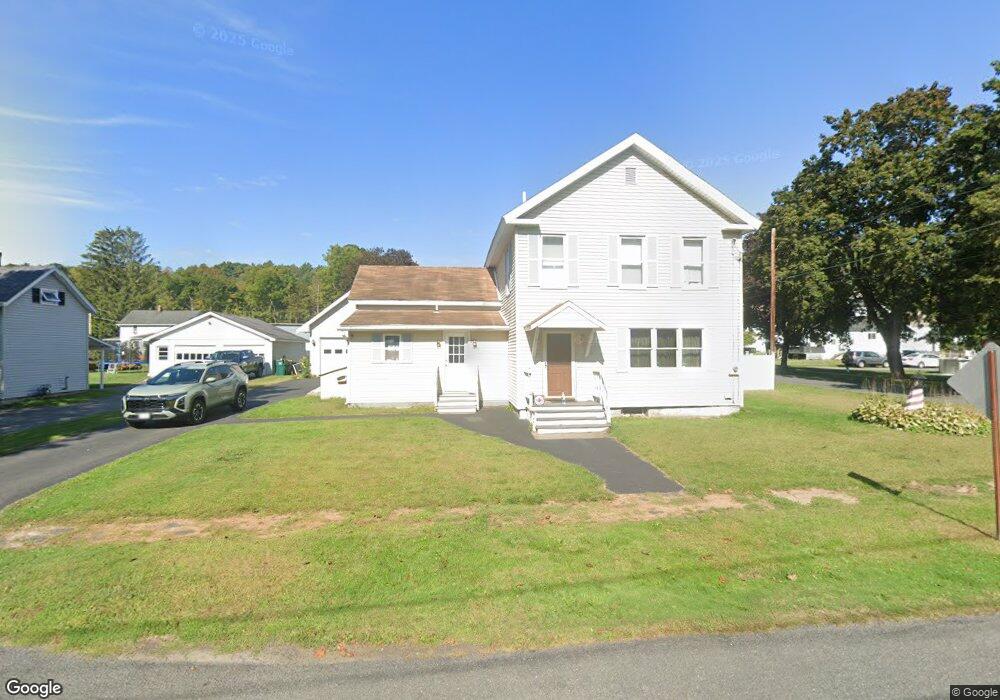
100 Dean St Cheshire, MA 01225
Estimated Value: $291,586 - $376,000
3
Beds
2
Baths
1,814
Sq Ft
$180/Sq Ft
Est. Value
About This Home
This home is located at 100 Dean St, Cheshire, MA 01225 and is currently estimated at $326,147, approximately $179 per square foot. 100 Dean St is a home located in Berkshire County with nearby schools including Hoosac Valley Middle & High School.
Ownership History
Date
Name
Owned For
Owner Type
Purchase Details
Closed on
Jul 8, 2016
Sold by
Fachini Robert and Fachini Bonnie J
Bought by
Poulton Ryan and Poulton Brittani K
Current Estimated Value
Home Financials for this Owner
Home Financials are based on the most recent Mortgage that was taken out on this home.
Original Mortgage
$164,000
Outstanding Balance
$128,692
Interest Rate
3.64%
Mortgage Type
VA
Estimated Equity
$197,455
Purchase Details
Closed on
Aug 6, 1993
Sold by
Poulton Charles and Poulton Angelina M
Bought by
Fachini Robert and Fachim Bonnie J
Create a Home Valuation Report for This Property
The Home Valuation Report is an in-depth analysis detailing your home's value as well as a comparison with similar homes in the area
Home Values in the Area
Average Home Value in this Area
Purchase History
| Date | Buyer | Sale Price | Title Company |
|---|---|---|---|
| Poulton Ryan | $164,000 | -- | |
| Poulton Ryan J | $164,000 | -- | |
| Fachini Robert | $95,000 | -- | |
| Fachini Robert C | $95,000 | -- |
Source: Public Records
Mortgage History
| Date | Status | Borrower | Loan Amount |
|---|---|---|---|
| Open | Poulton Ryan J | $164,000 | |
| Closed | Poulton Ryan J | $164,000 | |
| Previous Owner | Fachini Robert C | $113,000 | |
| Previous Owner | Fachini Robert C | $125,000 |
Source: Public Records
Tax History
| Year | Tax Paid | Tax Assessment Tax Assessment Total Assessment is a certain percentage of the fair market value that is determined by local assessors to be the total taxable value of land and additions on the property. | Land | Improvement |
|---|---|---|---|---|
| 2025 | $2,885 | $259,200 | $46,300 | $212,900 |
| 2024 | $2,807 | $242,600 | $44,200 | $198,400 |
| 2023 | $2,681 | $224,000 | $46,900 | $177,100 |
| 2022 | $2,437 | $191,000 | $49,300 | $141,700 |
| 2021 | $65 | $181,900 | $46,900 | $135,000 |
| 2020 | $67 | $179,500 | $46,900 | $132,600 |
| 2019 | $2,278 | $173,900 | $43,500 | $130,400 |
| 2018 | $2,123 | $167,700 | $43,500 | $124,200 |
| 2017 | $2,078 | $167,700 | $43,500 | $124,200 |
| 2016 | $2,056 | $167,700 | $43,500 | $124,200 |
| 2015 | $1,977 | $165,600 | $38,800 | $126,800 |
Source: Public Records
Map
Nearby Homes
Your Personal Tour Guide
Ask me questions while you tour the home.