
Landlord's Agent in 2022
Anthony Stanton
Boston Realty Company
(781) 964-6626
25 Total Sales
Estimated Value: $628,000 - $686,000
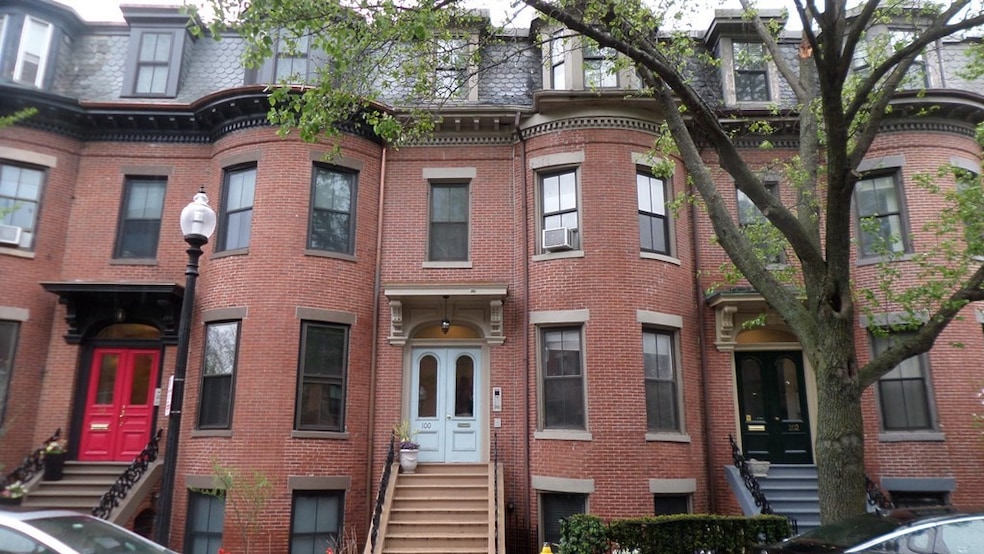
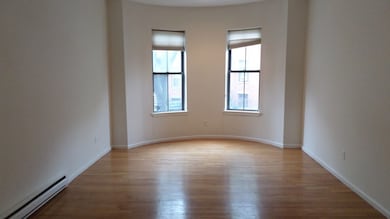
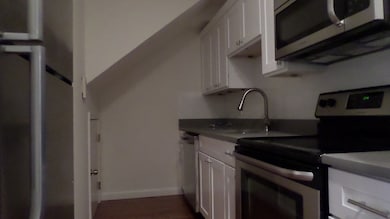
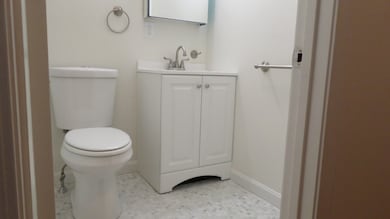
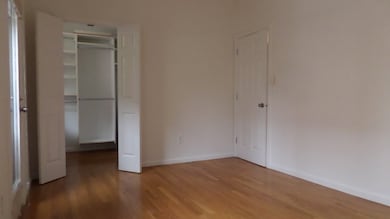
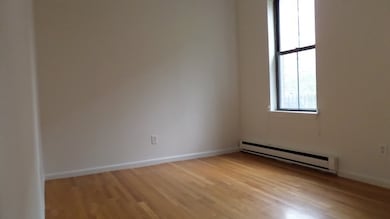
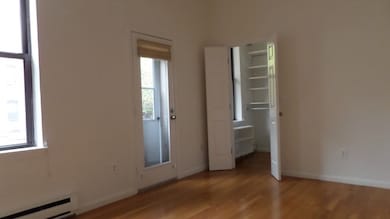
Stone’s throw to Boston Medical Center. Beautiful, renovated, 1 bedroom with a newer kitchen and bathroom. In-unit washer and dryer, private rear deck, stone counters, hardwood floors, custom tiling, lots of light.
We collect this data history from publicly available records. To have your information removed, we recommend requesting removal directly through your county’s website.
We collect this data history from publicly available records. To have your information removed, we recommend requesting removal directly through your county’s website.
| Date | Buyer | Sale Price | Title Company |
|---|---|---|---|
| -- | None Available | ||
| -- | None Available | ||
| $541,000 | -- | ||
| $541,000 | -- | ||
| -- | -- | ||
| -- | -- | ||
| -- | -- | ||
| -- | -- | ||
| $23,131 | -- | ||
| $23,131 | -- | ||
| $23,131 | -- | ||
| $23,131 | -- |
We collect this data history from publicly available records. To have your information removed, we recommend requesting removal directly through your county’s website.
| Date | Status | Borrower | Loan Amount |
|---|---|---|---|
| Previous Owner | $300,000 | ||
| Previous Owner | $20,000 |
We collect this data history from publicly available records. To have your information removed, we recommend requesting removal directly through your county’s website.
| Date | Event | Price | List to Sale | Price per Sq Ft | Prior Sale |
|---|---|---|---|---|---|
| 03/04/2026 03/04/26 | Off Market | $2,900 | -- | -- | |
| 01/11/2026 01/11/26 | For Rent | $2,900 | 0.0% | -- | |
| 12/16/2025 12/16/25 | Off Market | $2,900 | -- | -- | |
| 11/13/2025 11/13/25 | Price Changed | $2,900 | -12.1% | $5 / Sq Ft | |
| 11/10/2025 11/10/25 | For Rent | $3,300 | +11.9% | -- | |
| 06/05/2022 06/05/22 | Rented | $2,950 | 0.0% | -- | |
| 06/04/2022 06/04/22 | Under Contract | -- | -- | -- | |
| 04/19/2022 04/19/22 | For Rent | $2,950 | +56.5% | -- | |
| 11/02/2020 11/02/20 | For Rent | $1,885 | 0.0% | -- | |
| 10/31/2020 10/31/20 | Off Market | $1,885 | -- | -- | |
| 10/15/2020 10/15/20 | Rented | $1,885 | 0.0% | -- | |
| 09/29/2020 09/29/20 | Price Changed | $1,885 | -3.1% | $3 / Sq Ft | |
| 09/25/2020 09/25/20 | Price Changed | $1,945 | -1.5% | $3 / Sq Ft | |
| 09/21/2020 09/21/20 | Price Changed | $1,975 | -1.3% | $3 / Sq Ft | |
| 09/09/2020 09/09/20 | Price Changed | $2,000 | -17.5% | $3 / Sq Ft | |
| 08/21/2020 08/21/20 | Price Changed | $2,425 | -2.8% | $4 / Sq Ft | |
| 08/07/2020 08/07/20 | Price Changed | $2,495 | -5.8% | $4 / Sq Ft | |
| 07/29/2020 07/29/20 | Price Changed | $2,650 | -3.6% | $4 / Sq Ft | |
| 07/19/2020 07/19/20 | Price Changed | $2,750 | -1.8% | $5 / Sq Ft | |
| 07/01/2020 07/01/20 | For Rent | $2,800 | +5.7% | -- | |
| 07/14/2017 07/14/17 | Rented | $2,650 | 0.0% | -- | |
| 07/02/2017 07/02/17 | Under Contract | -- | -- | -- | |
| 05/22/2017 05/22/17 | Price Changed | $2,650 | -3.6% | $4 / Sq Ft | |
| 05/07/2017 05/07/17 | For Rent | $2,750 | 0.0% | -- | |
| 04/28/2017 04/28/17 | Sold | $541,000 | +3.0% | $897 / Sq Ft | View Prior Sale |
| 03/10/2017 03/10/17 | Pending | -- | -- | -- | |
| 03/07/2017 03/07/17 | For Sale | $525,000 | -- | $871 / Sq Ft |
We collect this data history from publicly available records. To have your information removed, we recommend requesting removal directly through your county’s website.
| Year | Tax Paid | Tax Assessment Tax Assessment Total Assessment is a certain percentage of the fair market value that is determined by local assessors to be the total taxable value of land and additions on the property. | Land | Improvement |
|---|---|---|---|---|
| 2025 | $6,800 | $587,200 | $0 | $587,200 |
| 2024 | $6,241 | $572,600 | $0 | $572,600 |
| 2023 | $6,027 | $561,200 | $0 | $561,200 |
| 2022 | $6,046 | $555,700 | $0 | $555,700 |
| 2021 | $5,813 | $544,800 | $0 | $544,800 |
| 2020 | $5,463 | $517,300 | $0 | $517,300 |
| 2019 | $5,292 | $502,100 | $0 | $502,100 |
| 2018 | $4,626 | $441,400 | $0 | $441,400 |
| 2017 | $4,452 | $420,400 | $0 | $420,400 |
| 2016 | $4,446 | $404,200 | $0 | $404,200 |
| 2015 | $4,148 | $342,500 | $0 | $342,500 |
| 2014 | $3,910 | $310,800 | $0 | $310,800 |
Landlord's Agent in 2022
Anthony Stanton
Boston Realty Company
(781) 964-6626
25 Total Sales
D
Buyer's Agent in 2020
Daniel Vazquez
Chinatti Realty Group, Inc.
Seller's Agent in 2017
John Corcoran
Compass
(617) 388-3609
6 in this area
29 Total Sales
Buyer's Agent in 2017
ellen mulder
Amo Realty - Boston City Properties
(484) 678-3402
1 in this area
29 Total Sales
Source: MLS Property Information Network (MLS PIN)
MLS Number: 73452835
APN: CBOS-000000-000008-001226-000004
Disclaimer: Certain information contained herein is derived from information provided by parties other than Homes.com. All information provided is deemed reliable, but is not guaranteed to be accurate and should be independently verified.
![]() The property listing data and information, or the Images, set forth herein were provided to MLS Property Information Network, Inc. from third party sources, including sellers, lessors and public records, and were compiled by MLS Property Information Network, Inc. The property listing data and information, and the Images, are for the personal, non-commercial use of consumers having a good faith interest in purchasing or leasing listed properties of the type displayed to them and may not be used for any purpose other than to identify prospective properties which such consumers may have a good faith interest in purchasing or leasing. MLS Property Information Network, Inc. and its subscribers disclaim any and all representations and warranties as to the accuracy of the property listing data and information, or as to the accuracy of any of the Images, set forth herein.
The property listing data and information, or the Images, set forth herein were provided to MLS Property Information Network, Inc. from third party sources, including sellers, lessors and public records, and were compiled by MLS Property Information Network, Inc. The property listing data and information, and the Images, are for the personal, non-commercial use of consumers having a good faith interest in purchasing or leasing listed properties of the type displayed to them and may not be used for any purpose other than to identify prospective properties which such consumers may have a good faith interest in purchasing or leasing. MLS Property Information Network, Inc. and its subscribers disclaim any and all representations and warranties as to the accuracy of the property listing data and information, or as to the accuracy of any of the Images, set forth herein.
Ask me questions while you tour the home.