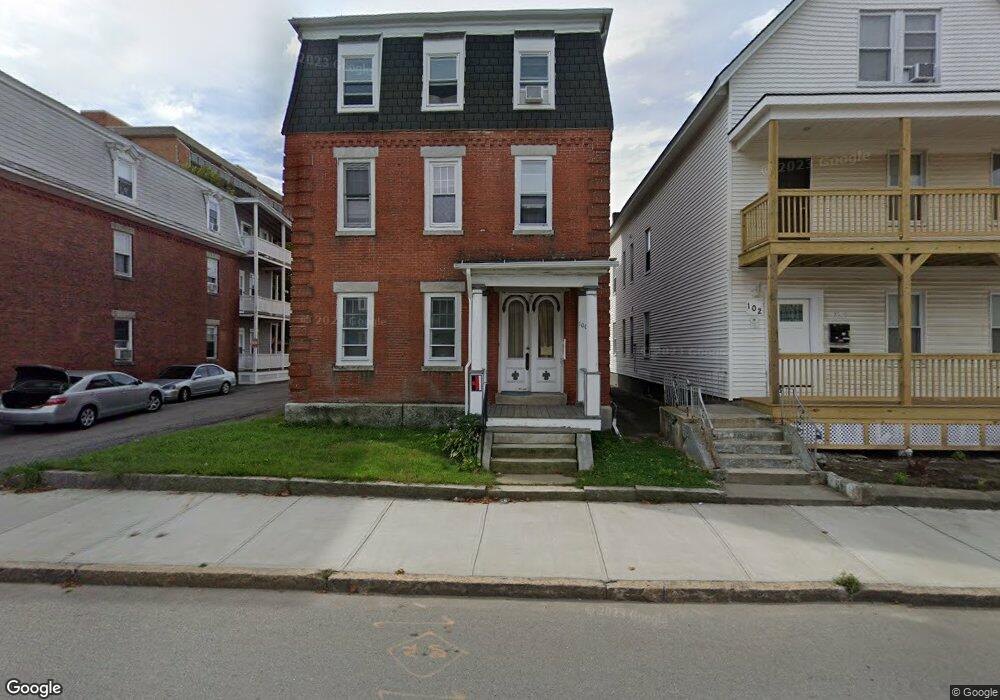
100 Elm St Worcester, MA 01609
Elm Park NeighborhoodEstimated Value: $562,887 - $739,000
6
Beds
3
Baths
3,696
Sq Ft
$177/Sq Ft
Est. Value
About This Home
This home is located at 100 Elm St, Worcester, MA 01609 and is currently estimated at $653,722, approximately $176 per square foot. 100 Elm St is a home located in Worcester County with nearby schools including Jacob Hiatt Magnet School, Chandler Magnet, and Elm Park Elementary School.
Ownership History
Date
Name
Owned For
Owner Type
Purchase Details
Closed on
Jan 16, 2008
Sold by
Audet David J
Bought by
Akpaki Emile K
Current Estimated Value
Home Financials for this Owner
Home Financials are based on the most recent Mortgage that was taken out on this home.
Original Mortgage
$210,000
Interest Rate
6.02%
Mortgage Type
Purchase Money Mortgage
Purchase Details
Closed on
Mar 30, 2001
Sold by
Cabot Antonia R
Bought by
Audet David J
Create a Home Valuation Report for This Property
The Home Valuation Report is an in-depth analysis detailing your home's value as well as a comparison with similar homes in the area
Home Values in the Area
Average Home Value in this Area
Purchase History
| Date | Buyer | Sale Price | Title Company |
|---|---|---|---|
| Akpaki Emile K | $280,000 | -- | |
| Audet David J | $195,000 | -- |
Source: Public Records
Mortgage History
| Date | Status | Borrower | Loan Amount |
|---|---|---|---|
| Open | Audet David J | $202,900 | |
| Closed | Akpaki Emile K | $210,000 | |
| Previous Owner | Audet David J | $43,000 | |
| Previous Owner | Audet David J | $174,400 | |
| Previous Owner | Audet David J | $8,904 |
Source: Public Records
Tax History
| Year | Tax Paid | Tax Assessment Tax Assessment Total Assessment is a certain percentage of the fair market value that is determined by local assessors to be the total taxable value of land and additions on the property. | Land | Improvement |
|---|---|---|---|---|
| 2025 | $7,531 | $571,000 | $46,900 | $524,100 |
| 2024 | $6,875 | $500,000 | $46,900 | $453,100 |
| 2023 | $6,571 | $458,200 | $37,600 | $420,600 |
| 2022 | $5,731 | $376,800 | $30,100 | $346,700 |
| 2021 | $5,280 | $324,300 | $24,100 | $300,200 |
| 2020 | $4,833 | $284,300 | $24,100 | $260,200 |
| 2019 | $3,834 | $213,000 | $23,800 | $189,200 |
| 2018 | $3,729 | $197,200 | $23,800 | $173,400 |
| 2017 | $3,477 | $180,900 | $23,800 | $157,100 |
| 2016 | $3,427 | $166,300 | $20,300 | $146,000 |
| 2015 | $3,338 | $166,300 | $20,300 | $146,000 |
| 2014 | $3,250 | $166,300 | $20,300 | $146,000 |
Source: Public Records
Map
Nearby Homes
- 6 Pelham St
- 8 Pelham St
- 89 William St
- 3 Marston Way
- 46 Townsend St
- 13 Hampden St
- 13 West St
- 56 Elm St Unit 2
- 20 Ashland St Unit 3L
- 12 Winslow St
- 60 Fruit St
- 14 Ashland St Unit 2R
- 172 Russell St
- 9 Dover St
- 8 Crown St
- 38 1/2 Bowdoin St
- 29 William St Unit 22
- 10 Trowbridge Rd
- 146 -152 Chandler
- 59 Dover St
Your Personal Tour Guide
Ask me questions while you tour the home.