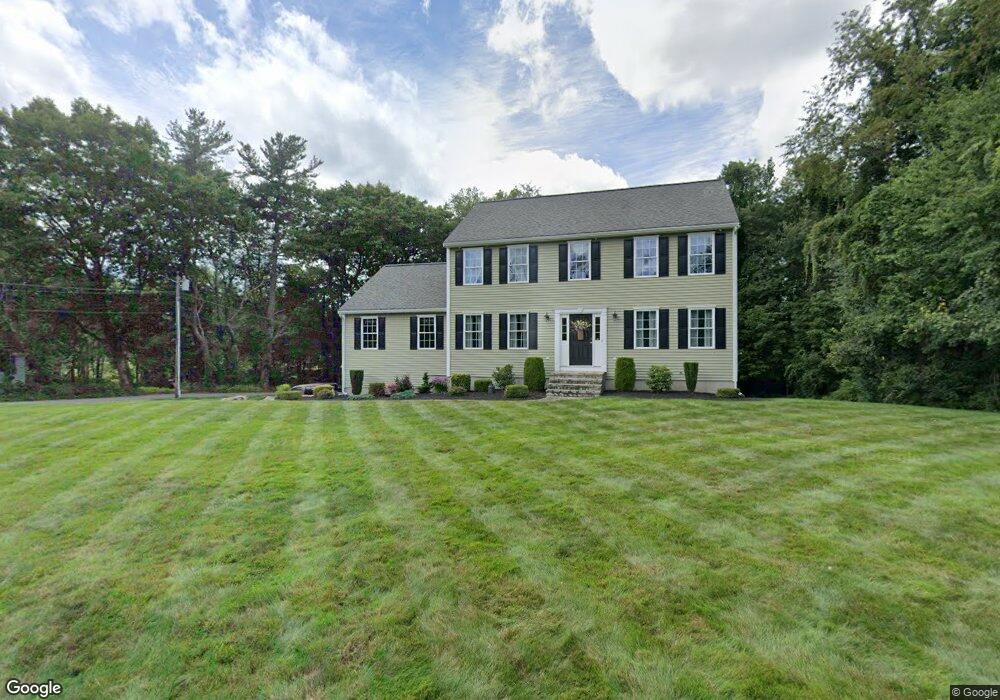
100 Laurel St Paxton, MA 01612
Estimated Value: $650,320 - $685,000
4
Beds
3
Baths
2,304
Sq Ft
$289/Sq Ft
Est. Value
About This Home
This home is located at 100 Laurel St, Paxton, MA 01612 and is currently estimated at $666,330, approximately $289 per square foot. 100 Laurel St is a home located in Worcester County with nearby schools including Wachusett Regional High School.
Ownership History
Date
Name
Owned For
Owner Type
Purchase Details
Closed on
May 28, 2004
Sold by
W L Rt and Wyzkoczka William
Bought by
Bazinet Bruce L and Bazinet Lori A
Current Estimated Value
Home Financials for this Owner
Home Financials are based on the most recent Mortgage that was taken out on this home.
Original Mortgage
$214,000
Outstanding Balance
$103,768
Interest Rate
5.88%
Mortgage Type
Purchase Money Mortgage
Estimated Equity
$562,562
Purchase Details
Closed on
Oct 17, 2003
Sold by
Warren Richard J
Bought by
Wl Rt and Wyskoczka William
Create a Home Valuation Report for This Property
The Home Valuation Report is an in-depth analysis detailing your home's value as well as a comparison with similar homes in the area
Home Values in the Area
Average Home Value in this Area
Purchase History
We collect this data history from publicly available records. To have your information removed, we recommend requesting removal directly through your county’s website.
| Date | Buyer | Sale Price | Title Company |
|---|---|---|---|
| Bazinet Bruce L | $389,900 | -- | |
| Wl Rt | $98,000 | -- |
Source: Public Records
Mortgage History
We collect this data history from publicly available records. To have your information removed, we recommend requesting removal directly through your county’s website.
| Date | Status | Borrower | Loan Amount |
|---|---|---|---|
| Open | Bazinet Bruce L | $214,000 |
Source: Public Records
Tax History
| Year | Tax Paid | Tax Assessment Tax Assessment Total Assessment is a certain percentage of the fair market value that is determined by local assessors to be the total taxable value of land and additions on the property. | Land | Improvement |
|---|---|---|---|---|
| 2025 | $8,157 | $553,400 | $111,300 | $442,100 |
| 2024 | $8,318 | $517,600 | $111,300 | $406,300 |
| 2023 | $8,097 | $460,600 | $101,200 | $359,400 |
| 2022 | $7,835 | $412,800 | $101,200 | $311,600 |
| 2021 | $7,553 | $382,800 | $91,900 | $290,900 |
| 2020 | $6,825 | $345,900 | $83,500 | $262,400 |
| 2019 | $6,674 | $338,100 | $75,700 | $262,400 |
| 2018 | $6,509 | $318,600 | $72,200 | $246,400 |
| 2017 | $6,315 | $309,700 | $68,600 | $241,100 |
| 2016 | $5,930 | $288,000 | $68,600 | $219,400 |
| 2015 | $5,821 | $280,000 | $68,600 | $211,400 |
| 2014 | $5,634 | $274,700 | $68,600 | $206,100 |
Source: Public Records
Map
Nearby Homes
Your Personal Tour Guide
Ask me questions while you tour the home.