100 Michael Ct East Peoria, IL 61611
Estimated Value: $158,000 - $184,096
3
Beds
1
Bath
1,326
Sq Ft
$125/Sq Ft
Est. Value
About This Home
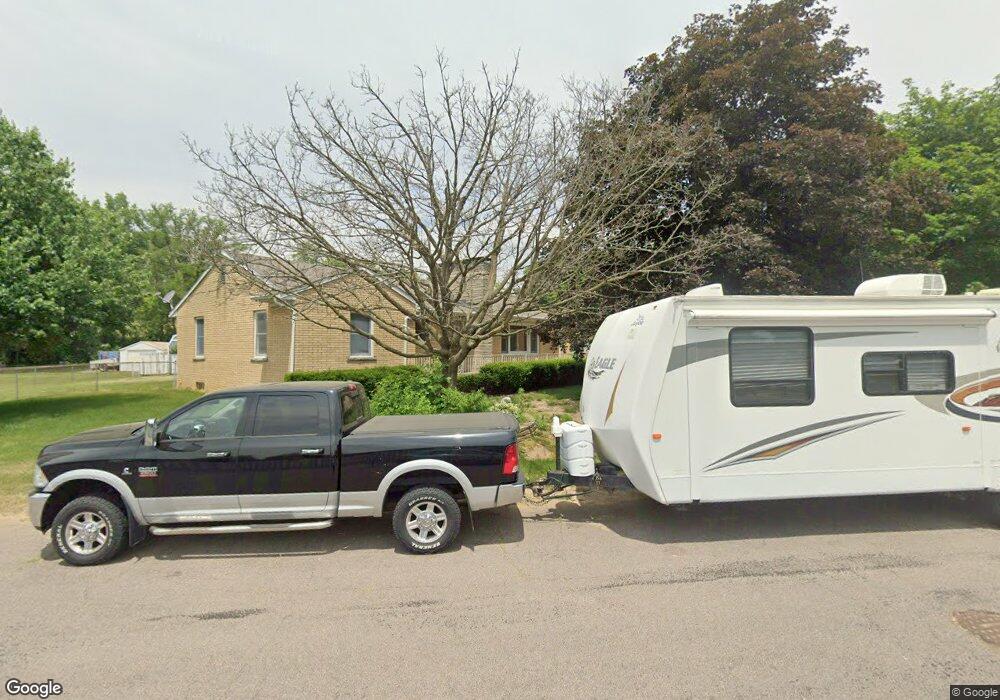
This home is located at 100 Michael Ct, East Peoria, IL 61611 and is currently estimated at $166,024, approximately $125 per square foot. 100 Michael Ct is a home located in Tazewell County with nearby schools including P.L. Bolin Elementary School, Neil A. Armstrong School, and Central Junior High School.
Ownership History
Date
Name
Owned For
Owner Type
Purchase Details
Closed on
Aug 1, 2023
Sold by
Cox Vicki Lynne
Bought by
Frank Julie A
Current Estimated Value
Home Financials for this Owner
Home Financials are based on the most recent Mortgage that was taken out on this home.
Original Mortgage
$133,000
Outstanding Balance
$129,785
Interest Rate
6.49%
Mortgage Type
New Conventional
Estimated Equity
$36,240
Purchase Details
Closed on
Jan 4, 2017
Sold by
Cox Vicki L and Cox Terry L
Bought by
Cox Vicki L
Create a Home Valuation Report for This Property
The Home Valuation Report is an in-depth analysis detailing your home's value as well as a comparison with similar homes in the area
Home Values in the Area
Average Home Value in this Area
Purchase History
| Date | Buyer | Sale Price | Title Company |
|---|---|---|---|
| Frank Julie A | $140,000 | None Listed On Document | |
| Cox Vicki L | -- | -- |
Source: Public Records
Mortgage History
| Date | Status | Borrower | Loan Amount |
|---|---|---|---|
| Open | Frank Julie A | $133,000 |
Source: Public Records
Tax History
| Year | Tax Paid | Tax Assessment Tax Assessment Total Assessment is a certain percentage of the fair market value that is determined by local assessors to be the total taxable value of land and additions on the property. | Land | Improvement |
|---|---|---|---|---|
| 2025 | $4,861 | $63,400 | $16,040 | $47,360 |
| 2024 | $4,188 | $59,650 | $15,090 | $44,560 |
| 2023 | $4,188 | $54,910 | $13,890 | $41,020 |
| 2022 | $3,595 | $51,030 | $12,910 | $38,120 |
| 2021 | $3,589 | $49,060 | $12,410 | $36,650 |
| 2020 | $3,510 | $47,630 | $12,050 | $35,580 |
| 2019 | $3,488 | $47,630 | $12,050 | $35,580 |
| 2018 | $3,393 | $47,630 | $12,050 | $35,580 |
| 2017 | $3,361 | $47,160 | $11,930 | $35,230 |
| 2016 | $3,278 | $47,160 | $11,930 | $35,230 |
| 2015 | $3,213 | $0 | $0 | $0 |
| 2013 | $3,235 | $47,160 | $11,930 | $35,230 |
Source: Public Records
Map
Nearby Homes
- 131 Arnold Rd
- Lot 7 Sundance Ln
- 1915 E Washington St
- 401 Illini Dr
- 147 Caroline St
- 600 Harbor Pointe Dr
- 140 Shoshone Dr
- 518 Harbor Pointe Dr
- 414 Harbor Pointe Dr
- 3304 E Washington St
- Lot 6 Oakwood Rd
- 00 Star Rim Dr
- 950 N Main St
- 207 Arnold Ave
- 108 Medina Ct
- 508 Avondale Dr
- 315 Oakbrook Dr
- 108 Turnron Place
- 230 Devron Cir
- 913 Springfield Rd
- 100 Michael Ct
- 169 Brookview Rd
- 168 Brookview Rd
- 166 Brookview Rd
- 160 Brookview Rd
- 158 Brookview Rd
- 201 Brookview Rd
- 112 Michael Ct
- 151 Brookview Rd
- 152 Brookview Rd
- 102 Martin St
- 153 Brookview Rd
- 202 Brookview Rd
- 150 Brookview Rd
- 118 Michael Ct
- 145 Brookview Rd
- 204 Brookview Rd
- 146 Brookview Rd
- 123 Michael Ct
- 155 Jay St
Your Personal Tour Guide
Ask me questions while you tour the home.