100 Odion St Unit 102 Springfield, MA 01118
East Forest Park NeighborhoodEstimated Value: $310,863 - $425,000
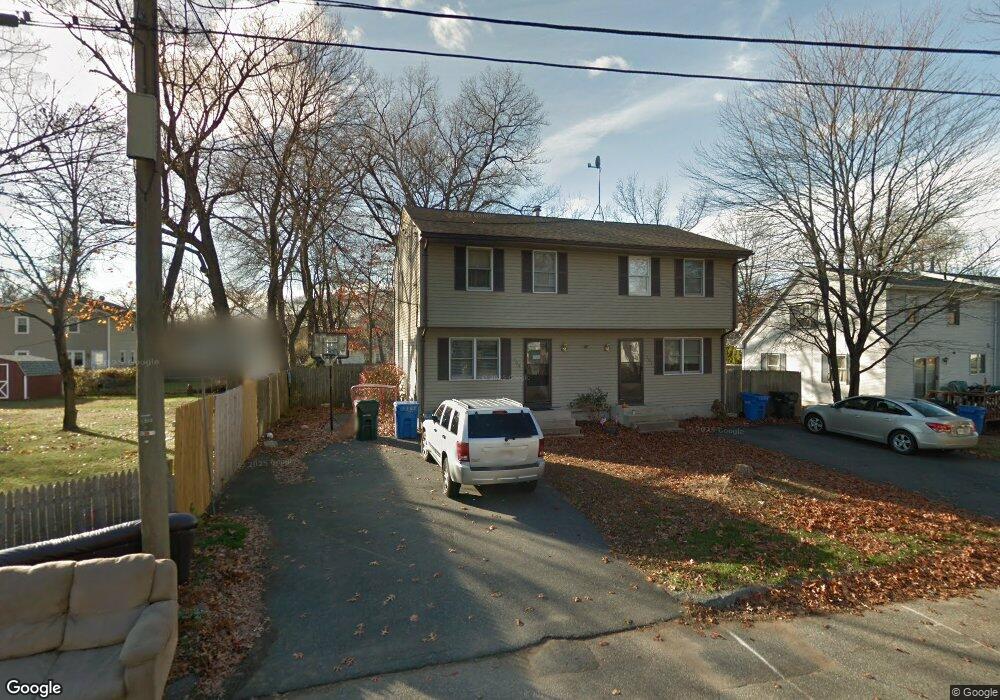
About This Home
This home is located at 100 Odion St Unit 102, Springfield, MA 01118 and is currently estimated at $377,966, approximately $184 per square foot. 100 Odion St Unit 102 is a home located in Hampden County with nearby schools including Frederick Harris Elementary School, M Marcus Kiley Middle, and Springfield High School of Science and Technology.
Ownership History
We collect this data history from publicly available records. To have your information removed, we recommend requesting removal directly through your county’s website.
Purchase Details
Purchase Details
Home Financials for this Owner
Home Financials are based on the most recent Mortgage that was taken out on this home.Purchase Details
Purchase Details
Home Financials for this Owner
Home Financials are based on the most recent Mortgage that was taken out on this home.Home Values in the Area
Average Home Value in this Area
Purchase History
We collect this data history from publicly available records. To have your information removed, we recommend requesting removal directly through your county’s website.
| Date | Buyer | Sale Price | Title Company |
|---|---|---|---|
| -- | None Available | ||
| $207,900 | -- | ||
| $172,565 | -- | ||
| $102,000 | -- |
Mortgage History
We collect this data history from publicly available records. To have your information removed, we recommend requesting removal directly through your county’s website.
| Date | Status | Borrower | Loan Amount |
|---|---|---|---|
| Previous Owner | $201,660 | ||
| Previous Owner | $96,900 |
Tax History
We collect this data history from publicly available records. To have your information removed, we recommend requesting removal directly through your county’s website.
| Year | Tax Paid | Tax Assessment Tax Assessment Total Assessment is a certain percentage of the fair market value that is determined by local assessors to be the total taxable value of land and additions on the property. | Land | Improvement |
|---|---|---|---|---|
| 2025 | $4,260 | $271,700 | $46,800 | $224,900 |
| 2024 | $5,250 | $326,900 | $46,800 | $280,100 |
| 2023 | $5,580 | $327,300 | $44,600 | $282,700 |
| 2022 | $4,793 | $254,700 | $44,600 | $210,100 |
| 2021 | $4,544 | $240,400 | $40,500 | $199,900 |
| 2020 | $4,308 | $220,600 | $40,500 | $180,100 |
| 2019 | $4,023 | $204,400 | $40,500 | $163,900 |
| 2018 | $4,106 | $199,200 | $40,500 | $158,700 |
| 2017 | $3,867 | $196,700 | $40,500 | $156,200 |
| 2016 | $3,674 | $186,900 | $40,500 | $146,400 |
| 2015 | $3,468 | $176,300 | $40,500 | $135,800 |
Map
- 53 Luden St
- 19 Orpheum Ave
- 217 Ellsworth Ave
- 2 Hazelhurst Ave
- 163 Powell Ave
- 220 W Allen Ridge Rd
- 655 N Main St
- 119 Powell Ave
- 3 Vineland Ave
- 75 Garland St
- 38 Manchester Terrace
- 57 Bither St
- 22 Audley Rd
- 125 E Allen Ridge Rd
- 100 Colorado St
- 120-122 Larkspur St
- 28 Bither St
- 107 Dorset St
- 143 Braeburn Rd
- 43 Ellsworth Ave
- 40 Tulsa St
- 100-102 Odion Ave
- 26 Tulsa St Unit 28
- 52 Tulsa St
- 37 Tulsa St Unit 39
- 31 Tulsa St Unit 33
- 23 Tulsa St Unit 25
- 16 Luden St
- 108 Odion St
- 31-33 Tulsa St
- 24 Luden St
- 98 Carr St
- 98 Carr St
- 110 Odion St
- 18 Luden St
- 23-25 Tulsa St
- 49 Tulsa St Unit 51
- 59 Tulsa St Unit 61
- 108B Carr St
- 108 Carr St
Ask me questions while you tour the home.