100 Pond St Georgetown, MA 01833
Estimated Value: $614,000 - $731,000
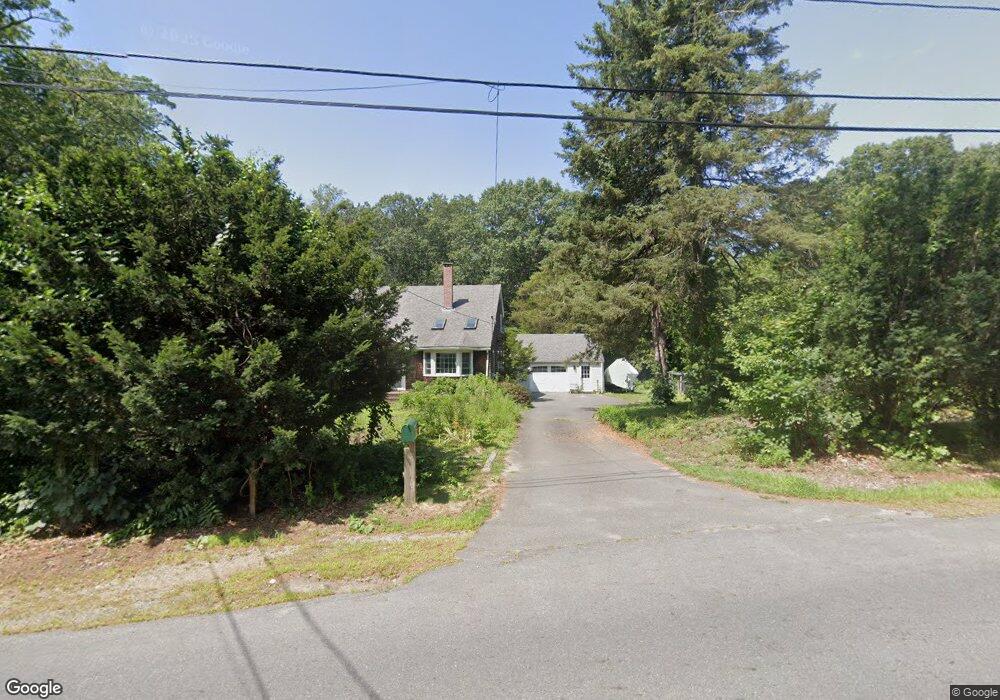
About This Home
This home is located at 100 Pond St, Georgetown, MA 01833 and is currently estimated at $674,367, approximately $378 per square foot. 100 Pond St is a home located in Essex County with nearby schools including Perley Elementary School, Penn Brook School, and Georgetown High School.
Ownership History
We collect this data history from publicly available records. To have your information removed, we recommend requesting removal directly through your county’s website.
Purchase Details
Purchase Details
Purchase Details
Home Financials for this Owner
Home Financials are based on the most recent Mortgage that was taken out on this home.Purchase Details
Purchase Details
Purchase Details
Purchase Details
Purchase Details
Purchase Details
Home Values in the Area
Average Home Value in this Area
Purchase History
We collect this data history from publicly available records. To have your information removed, we recommend requesting removal directly through your county’s website.
| Date | Buyer | Sale Price | Title Company |
|---|---|---|---|
| -- | -- | ||
| -- | -- | ||
| -- | -- | ||
| -- | None Available | ||
| -- | None Available | ||
| -- | None Available | ||
| $260,000 | -- | ||
| $260,000 | -- | ||
| $260,000 | -- | ||
| $307,000 | -- | ||
| $307,000 | -- | ||
| -- | -- | ||
| -- | -- | ||
| $270,500 | -- | ||
| $270,500 | -- | ||
| $219,500 | -- | ||
| $219,500 | -- | ||
| $194,000 | -- | ||
| $126,000 | -- |
Mortgage History
We collect this data history from publicly available records. To have your information removed, we recommend requesting removal directly through your county’s website.
| Date | Status | Borrower | Loan Amount |
|---|---|---|---|
| Previous Owner | $250,000 |
Tax History
We collect this data history from publicly available records. To have your information removed, we recommend requesting removal directly through your county’s website.
| Year | Tax Paid | Tax Assessment Tax Assessment Total Assessment is a certain percentage of the fair market value that is determined by local assessors to be the total taxable value of land and additions on the property. | Land | Improvement |
|---|---|---|---|---|
| 2025 | $6,838 | $618,300 | $292,500 | $325,800 |
| 2024 | $5,853 | $466,400 | $201,800 | $264,600 |
| 2023 | $6,054 | $466,400 | $201,800 | $264,600 |
| 2022 | $6,111 | $434,000 | $175,400 | $258,600 |
| 2021 | $5,727 | $360,400 | $175,400 | $185,000 |
| 2020 | $5,738 | $360,400 | $175,400 | $185,000 |
| 2019 | $5,635 | $357,100 | $172,100 | $185,000 |
| 2018 | $5,671 | $357,100 | $172,100 | $185,000 |
| 2017 | $5,581 | $344,300 | $172,100 | $172,200 |
| 2016 | $5,286 | $333,100 | $172,100 | $161,000 |
| 2015 | $5,134 | $320,300 | $172,100 | $148,200 |
| 2014 | $2,820 | $200,700 | $172,100 | $28,600 |
Map
- 83 Mill St
- 8 Molloy Rd
- 51 W Main St Unit 6
- 22 Nelson Ave
- 206 W Main St Unit 9
- 206 W Main St Unit 4
- 206 W Main St Unit 8
- 105 Lakeshore Dr
- 7 Lakeshore Dr Unit 7A
- 7 Lakeshore Dr
- 7 Byfield Rd
- 109 Thurlow St
- 83 Thurlow St
- 158 King St
- 9 Fazio Farm Rd
- 18 Stonebridge Rd
- 27 Searle St
- 20 Baldpate Rd
- 16 Thurlow St
- 24 Meadowview Rd
Ask me questions while you tour the home.