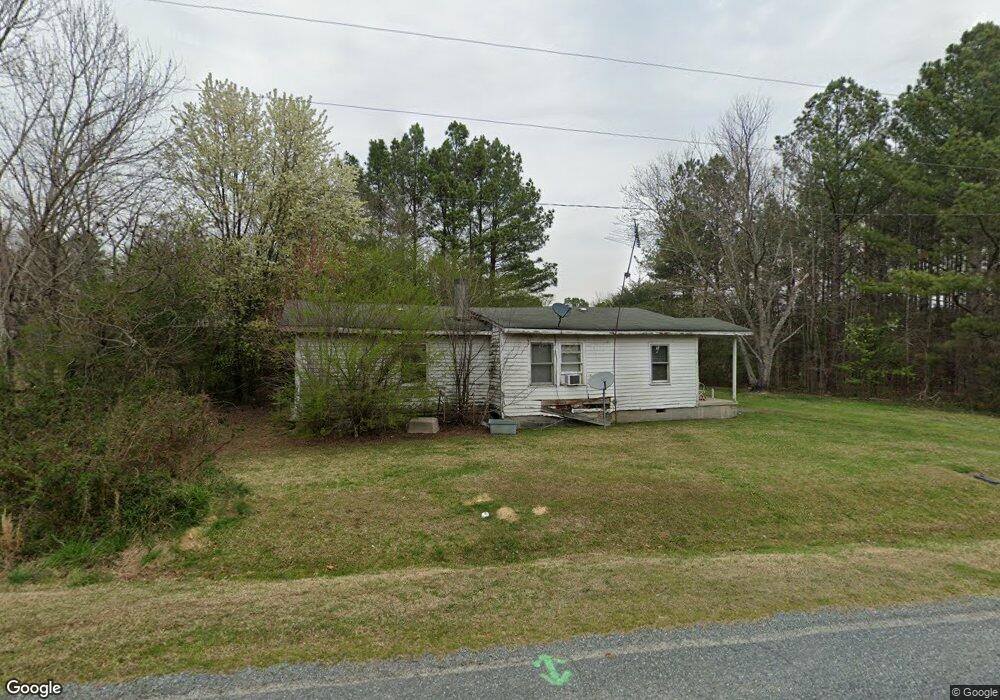
100 Unity Powerhouse Rd Staley, NC 27355
Estimated Value: $89,722 - $199,000
2
Beds
1
Bath
1,173
Sq Ft
$133/Sq Ft
Est. Value
About This Home
This home is located at 100 Unity Powerhouse Rd, Staley, NC 27355 and is currently estimated at $155,681, approximately $132 per square foot. 100 Unity Powerhouse Rd is a home with nearby schools including Siler City Elementary School, Chatham Middle, and Jordan Matthews High.
Ownership History
Date
Name
Owned For
Owner Type
Purchase Details
Closed on
Feb 12, 2015
Sold by
Mcmaster Betty R
Bought by
Edwards James R
Current Estimated Value
Create a Home Valuation Report for This Property
The Home Valuation Report is an in-depth analysis detailing your home's value as well as a comparison with similar homes in the area
Purchase History
| Date | Buyer | Sale Price | Title Company |
|---|---|---|---|
| Edwards James R | -- | None Available |
Source: Public Records
Tax History
| Year | Tax Paid | Tax Assessment Tax Assessment Total Assessment is a certain percentage of the fair market value that is determined by local assessors to be the total taxable value of land and additions on the property. | Land | Improvement |
|---|---|---|---|---|
| 2025 | $636 | $66,521 | $24,900 | $41,621 |
| 2024 | $636 | $46,199 | $19,900 | $26,299 |
| 2023 | $527 | $46,199 | $19,900 | $26,299 |
| 2022 | $488 | $46,199 | $19,900 | $26,299 |
| 2021 | $488 | $46,199 | $19,900 | $26,299 |
| 2020 | $542 | $52,724 | $17,741 | $34,983 |
| 2019 | $542 | $52,724 | $17,741 | $34,983 |
| 2018 | $504 | $52,724 | $17,741 | $34,983 |
| 2017 | $504 | $52,724 | $17,741 | $34,983 |
| 2016 | $527 | $55,500 | $18,675 | $36,825 |
| 2015 | $520 | $55,500 | $18,675 | $36,825 |
| 2014 | $520 | $55,500 | $18,675 | $36,825 |
| 2013 | -- | $55,500 | $18,675 | $36,825 |
Source: Public Records
Map
Nearby Homes
- Tbd Stockyard Rd
- 978 Stockyard Rd
- 2054 Stockyard Rd
- 1705 Wind Sound Way
- 1707 Wind Sound Way
- 1706 Wind Sound Way
- 3125 W 3rd St
- 1507 Duet Dr
- 2200 W 3rd St
- 1402 Harmony
- 1501 Duet Dr
- 0 Solo Dr Unit 10159379
- 1009 Driftwood Dr
- 3379 W 3rd St
- 901 Tanglewood Dr Extension
- N/A Driftwood Dr
- 352 Eden Hills Rd
- 257 Piney Grove Church Rd
- 430 W 9th St
- 56 N Hillcrest Rd
- 539 Stockyard Rd
- 61 Unity Powerhouse Rd
- 463 Stockyard Rd
- 565 Stockyard Rd
- 508 Stockyard Rd
- 618 Stockyard Rd
- 590 Stockyard Rd
- 608 Stockyard Rd
- 620 Stockyard Rd
- 611 Stockyard Rd
- 713 Stockyard Rd
- 712 Stockyard Rd
- 746 Stockyard Rd
- 34 Colonial Park Rd
- 0 Stockyard Rd Unit 1629381
- 0 Stockyard Rd Unit A & B TR1722619
- 0 Stockyard Rd
- 775 Stockyard Rd
- TBD Stockyard Rd
- 2054 Stockyard Rd
Your Personal Tour Guide
Ask me questions while you tour the home.