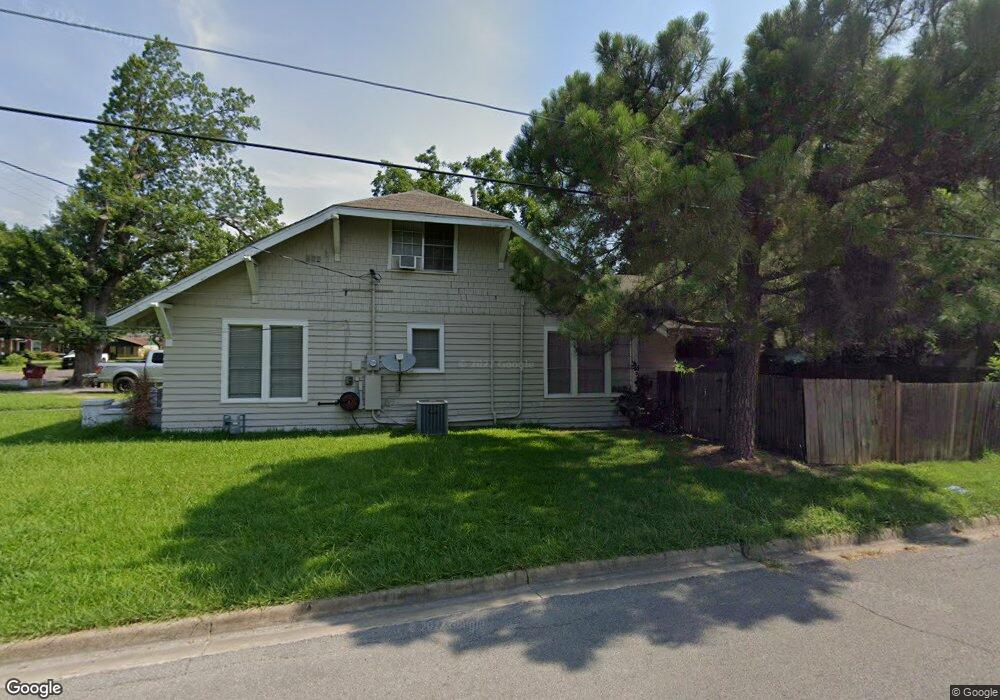
1002 Park Ave Bonham, TX 75418
Estimated Value: $128,000 - $220,000
3
Beds
2
Baths
2,018
Sq Ft
$92/Sq Ft
Est. Value
About This Home
This home is located at 1002 Park Ave, Bonham, TX 75418 and is currently estimated at $185,971, approximately $92 per square foot. 1002 Park Ave is a home located in Fannin County with nearby schools including Evans Elementary School, Finley-Oates Elementary School, and LH Rather Jr High School.
Ownership History
Date
Name
Owned For
Owner Type
Purchase Details
Closed on
Jul 31, 2009
Sold by
Herndon Joe P and Herndon Beverly A
Bought by
Arizmendi Natalie Ellen and Davis Edward C
Current Estimated Value
Home Financials for this Owner
Home Financials are based on the most recent Mortgage that was taken out on this home.
Original Mortgage
$80,514
Outstanding Balance
$52,680
Interest Rate
5.44%
Estimated Equity
$133,291
Create a Home Valuation Report for This Property
The Home Valuation Report is an in-depth analysis detailing your home's value as well as a comparison with similar homes in the area
Purchase History
We collect this data history from publicly available records. To have your information removed, we recommend requesting removal directly through your county’s website.
| Date | Buyer | Sale Price | Title Company |
|---|---|---|---|
| Arizmendi Natalie Ellen | -- | Cole Title Company |
Source: Public Records
Mortgage History
We collect this data history from publicly available records. To have your information removed, we recommend requesting removal directly through your county’s website.
| Date | Status | Borrower | Loan Amount |
|---|---|---|---|
| Open | Arizmendi Natalie Ellen | $80,514 |
Source: Public Records
Tax History
| Year | Tax Paid | Tax Assessment Tax Assessment Total Assessment is a certain percentage of the fair market value that is determined by local assessors to be the total taxable value of land and additions on the property. | Land | Improvement |
|---|---|---|---|---|
| 2025 | $2,945 | $151,824 | $42,020 | $109,804 |
| 2024 | $2,851 | $146,970 | $40,020 | $106,950 |
| 2023 | $2,859 | $145,000 | $38,520 | $106,480 |
| 2022 | $2,952 | $134,210 | $27,020 | $107,190 |
| 2021 | $2,699 | $106,780 | $13,010 | $93,770 |
| 2020 | $2,470 | $96,630 | $10,110 | $86,520 |
| 2019 | $2,469 | $92,910 | $9,910 | $83,000 |
| 2018 | $2,093 | $78,872 | $8,556 | $70,316 |
| 2017 | $1,764 | $69,000 | $4,600 | $64,400 |
| 2016 | $1,685 | $65,920 | $4,600 | $61,320 |
| 2015 | -- | $61,340 | $4,400 | $56,940 |
| 2014 | -- | $61,530 | $3,570 | $57,960 |
Source: Public Records
Map
Nearby Homes
Your Personal Tour Guide
Ask me questions while you tour the home.