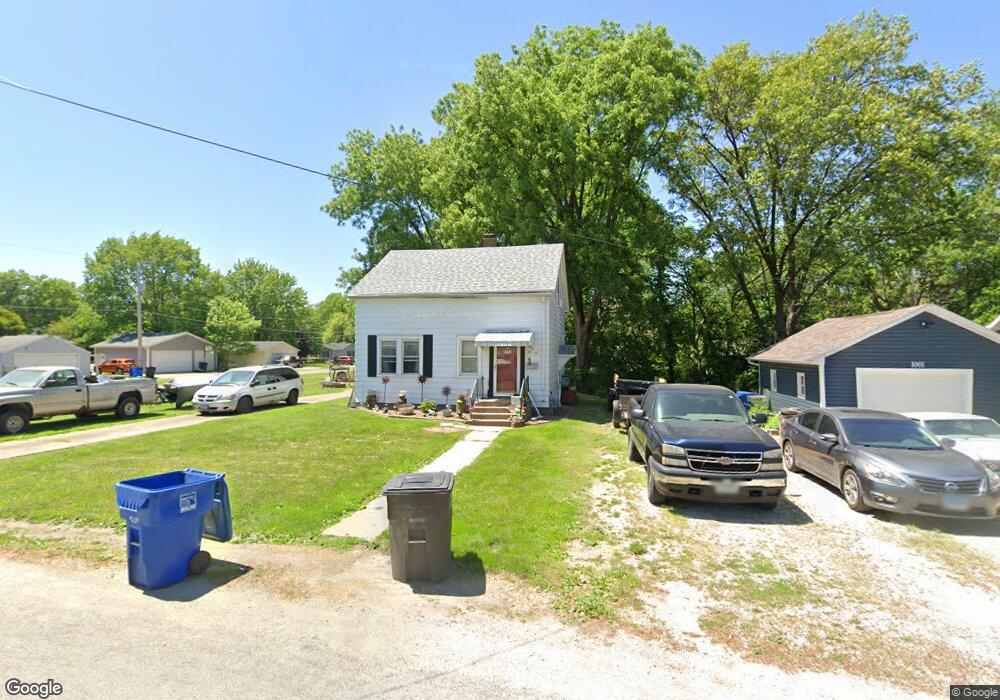
1005 52nd St Moline, IL 61265
Estimated Value: $104,087 - $165,000
3
Beds
--
Bath
864
Sq Ft
$158/Sq Ft
Est. Value
About This Home
This home is located at 1005 52nd St, Moline, IL 61265 and is currently estimated at $136,522, approximately $158 per square foot. 1005 52nd St is a home located in Rock Island County with nearby schools including Benjamin Franklin Elementary School, Woodrow Wilson Middle School, and Moline Sr High School.
Ownership History
Date
Name
Owned For
Owner Type
Purchase Details
Closed on
Jul 17, 2025
Sold by
Eagle Property Holdings Llc
Bought by
Eph 1 Llc
Current Estimated Value
Purchase Details
Closed on
Mar 2, 2018
Sold by
Welch Kevin L
Bought by
Eagle Property Holdings Llc
Home Financials for this Owner
Home Financials are based on the most recent Mortgage that was taken out on this home.
Original Mortgage
$108,800
Interest Rate
4.04%
Mortgage Type
New Conventional
Create a Home Valuation Report for This Property
The Home Valuation Report is an in-depth analysis detailing your home's value as well as a comparison with similar homes in the area
Home Values in the Area
Average Home Value in this Area
Purchase History
| Date | Buyer | Sale Price | Title Company |
|---|---|---|---|
| Eph 1 Llc | -- | Gomez Title | |
| Eagle Property Holdings Llc | -- | Lee Graham J |
Source: Public Records
Mortgage History
| Date | Status | Borrower | Loan Amount |
|---|---|---|---|
| Previous Owner | Eagle Property Holdings Llc | $108,800 |
Source: Public Records
Tax History
| Year | Tax Paid | Tax Assessment Tax Assessment Total Assessment is a certain percentage of the fair market value that is determined by local assessors to be the total taxable value of land and additions on the property. | Land | Improvement |
|---|---|---|---|---|
| 2024 | $3,259 | $36,937 | $12,368 | $24,569 |
| 2023 | $3,259 | $34,620 | $11,824 | $22,796 |
| 2022 | $3,150 | $34,620 | $11,824 | $22,796 |
| 2021 | $3,139 | $33,066 | $11,293 | $21,773 |
| 2020 | $3,155 | $32,869 | $11,226 | $21,643 |
| 2019 | $3,101 | $32,099 | $10,963 | $21,136 |
| 2018 | $3,091 | $32,366 | $10,833 | $21,533 |
| 2017 | $3,023 | $31,700 | $10,610 | $21,090 |
| 2016 | $2,987 | $31,170 | $10,433 | $20,737 |
| 2015 | $2,924 | $30,528 | $10,218 | $20,310 |
| 2014 | $559 | $30,487 | $10,205 | $20,282 |
| 2013 | $559 | $30,487 | $10,205 | $20,282 |
Source: Public Records
Map
Nearby Homes
- 5100 11th Avenue C
- 4828 6th Avenue Dr
- 4610 8th Ave
- 500 54th St Unit A
- 4510 5th Ave
- 2218 3rd St
- 422 45th St
- 1926 3rd St
- 430 26th Ave
- 4202 10th Ave
- 1816 53rd St Unit 9
- 2907 4th Street A
- 4118 10th Ave
- 212 44th St
- 4216 13th Ave
- 5420 Old River Dr
- 1700 46th St
- 1940 4th Street A
- 906 40th Street Ct
- 5406 20th Avenue Ct
Your Personal Tour Guide
Ask me questions while you tour the home.