1006 S Walnut St Bloomington, IN 47401
McDoel Gardens NeighborhoodEstimated payment $3,293/month
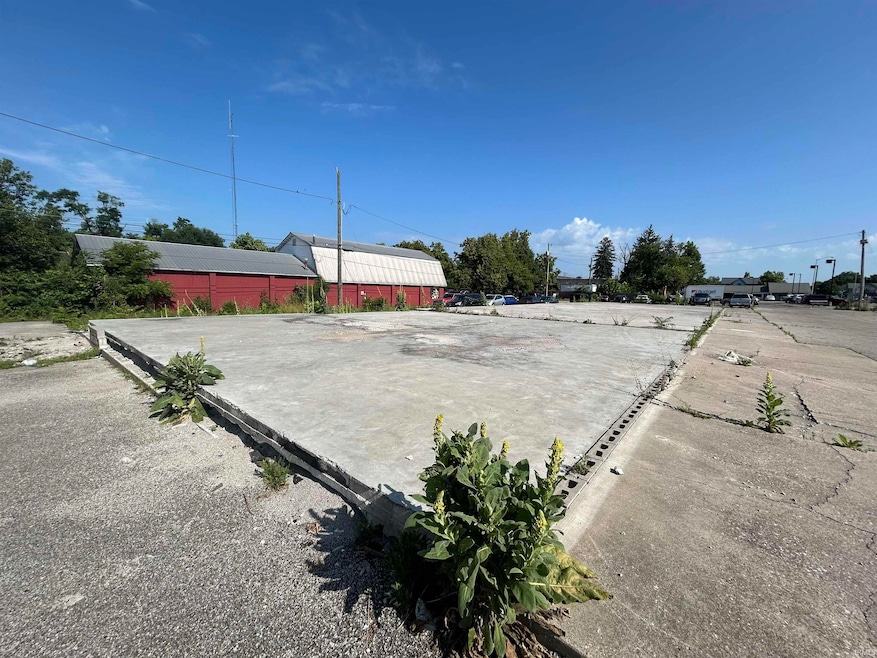
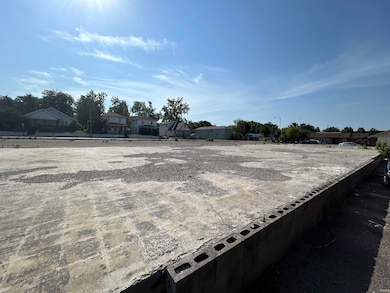
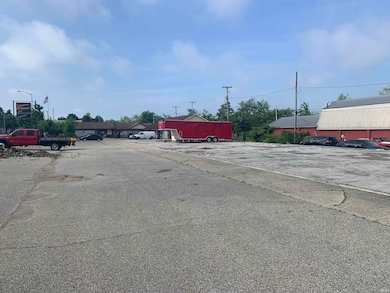
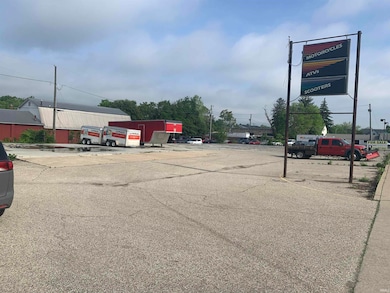
About This Lot
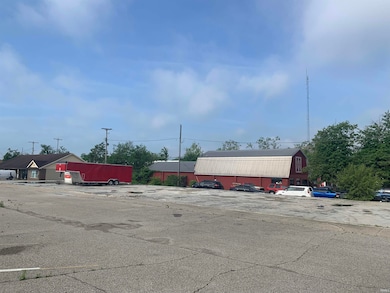
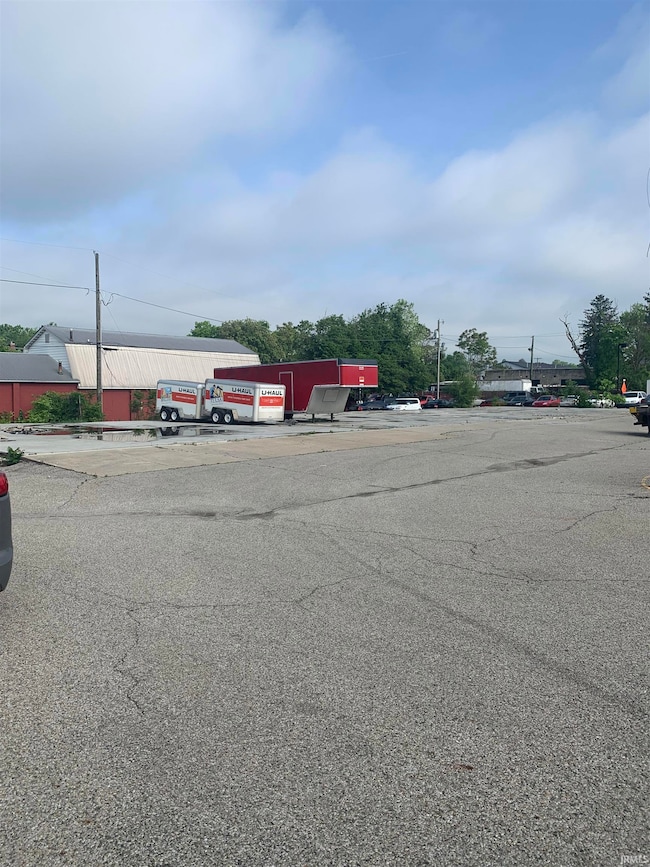
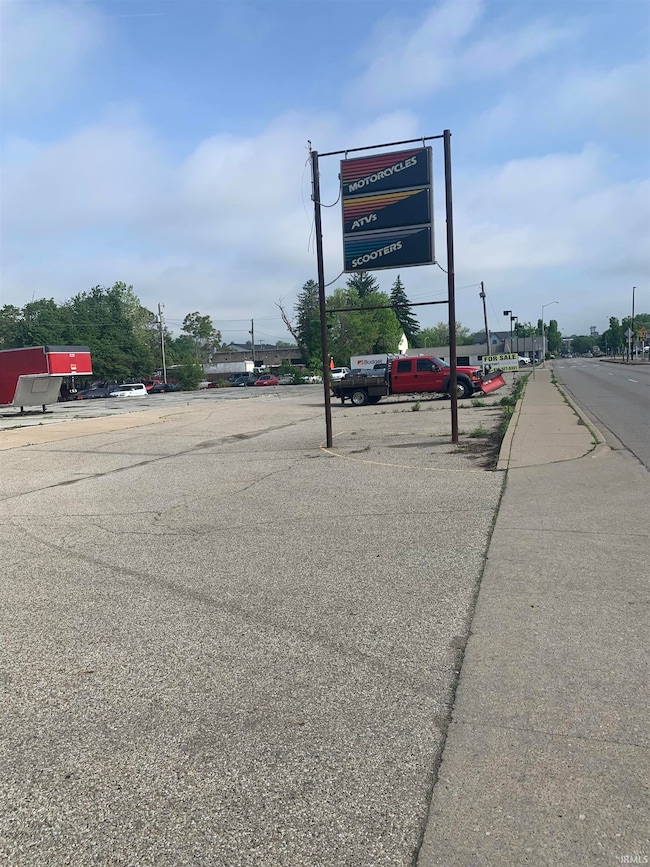
Excellent and rare development opportunity close to downtown! Located on the corner of S Walnut Street and West Allen Street. Lot is zoned Mixed Use Corridor. See permitted use description attached to the listing.
Property Details
Property Type
- Land
Est. Annual Taxes
- $3,903
Lot Details
- 27,878 Sq Ft Lot
- Finished Lot(s)
- Zoning described as Mixed Use Corridor
Parking
- Driveway
Schools
- Templeton Elementary School
- Jackson Creek Middle School
- Bloomington South High School
Utilities
- Gas Available
Listing and Financial Details
- Assessor Parcel Number 53-08-04-300-104.000-009
Map
Home Values in the Area
Average Home Value in this Area
Tax History
We collect this data history from publicly available records. To have your information removed, we recommend requesting removal directly through your county’s website.
| Year | Tax Paid | Tax Assessment Tax Assessment Total Assessment is a certain percentage of the fair market value that is determined by local assessors to be the total taxable value of land and additions on the property. | Land | Improvement |
|---|---|---|---|---|
| 2025 | $3,863 | $406,400 | $400,800 | $5,600 |
| 2024 | $3,863 | $188,700 | $183,000 | $5,700 |
| 2023 | $1,995 | $188,600 | $183,000 | $5,600 |
| 2022 | $3,823 | $188,800 | $183,000 | $5,800 |
| 2021 | $3,903 | $188,300 | $183,000 | $5,300 |
| 2020 | $3,892 | $188,300 | $183,000 | $5,300 |
| 2019 | $4,345 | $205,700 | $91,500 | $114,200 |
| 2018 | $4,368 | $205,700 | $91,500 | $114,200 |
| 2017 | $4,286 | $202,000 | $91,500 | $110,500 |
| 2016 | $4,402 | $212,100 | $91,500 | $120,600 |
| 2014 | $4,391 | $210,900 | $91,500 | $119,400 |
Property History
We collect this data history from publicly available records. To have your information removed, we recommend requesting removal directly through your county’s website.
| Date | Event | Price | List to Sale | Price per Sq Ft |
|---|---|---|---|---|
| 08/01/2025 08/01/25 | Price Changed | $550,000 | -21.3% | -- |
| 06/18/2025 06/18/25 | Price Changed | $699,000 | -12.5% | -- |
| 05/08/2025 05/08/25 | Price Changed | $799,000 | -11.1% | -- |
| 04/03/2025 04/03/25 | For Sale | $899,000 | -- | -- |
Purchase History
We collect this data history from publicly available records. To have your information removed, we recommend requesting removal directly through your county’s website.
| Date | Type | Sale Price | Title Company |
|---|---|---|---|
| Deed | $825,000 | -- | |
| Warranty Deed | $825,000 | Titleplus! |
Source: Indiana Regional MLS
MLS Number: 202511170
APN: 53-08-04-300-104.000-009
Disclaimer: Certain information contained herein is derived from information provided by parties other than Homes.com. All information provided is deemed reliable, but is not guaranteed to be accurate and should be independently verified.
![]() Based on information submitted to the MLS GRID. All data is obtained from various sources and may not have been verified by broker or MLS GRID. Supplied Open House Information is subject to change without notice. All information should be independently reviewed and verified for accuracy. Properties may or may not be listed by the office/agent presenting the information. Some IDX listings have been excluded from this website. IDX information is provided exclusively for personal, non-commercial use, and may not be used for any purpose other than to identify prospective properties consumers may be interested in purchasing. Information is deemed reliable but not guaranteed.
Based on information submitted to the MLS GRID. All data is obtained from various sources and may not have been verified by broker or MLS GRID. Supplied Open House Information is subject to change without notice. All information should be independently reviewed and verified for accuracy. Properties may or may not be listed by the office/agent presenting the information. Some IDX listings have been excluded from this website. IDX information is provided exclusively for personal, non-commercial use, and may not be used for any purpose other than to identify prospective properties consumers may be interested in purchasing. Information is deemed reliable but not guaranteed.
Based on information submitted to the MLS GRID
- 120 E Dixie St
- 901 S Lincoln St
- 750 S Walnut St
- 1106 S Madison St
- 715 S Washington St
- 1209 S Lincoln St
- 322 W Dodds St
- 613 S Walnut St
- 1309 S Lincoln St
- 1312 S Grant St
- 105 E 1st St
- 542 S Walnut St
- 106 E Hillside Dr
- 206 E Hillside Dr
- 1412 S Grant St
- 402 E 1st St
- 306 E Hillside Dr
- 405 W Hillside Dr
- 614 W Dixie St
- TBD S Madison St
- 909 S Morton St
- 725 S Walnut St
- 1300 S Walnut St
- 1201 S Madison St
- 1209 S Lincoln St
- 718 S Lincoln St
- 105 E Wilson St
- 620 S Lincoln St
- 609 S Washington St
- 1407 S Washington St Unit B
- 1310 S Madison St Unit A
- 309 E Wylie St
- 1425 S Walnut St
- 1427 S Washington St Unit 1427 S Washington St, unit 100
- 1428 S Washington St
- 1503 S Walnut St Unit Apartment 200
- 1503 S Walnut St Unit Apartment 100
- 327-329 W 1st St
- 113 E Southern Dr
- 514 S Washington St

Ask me questions while you tour the home.