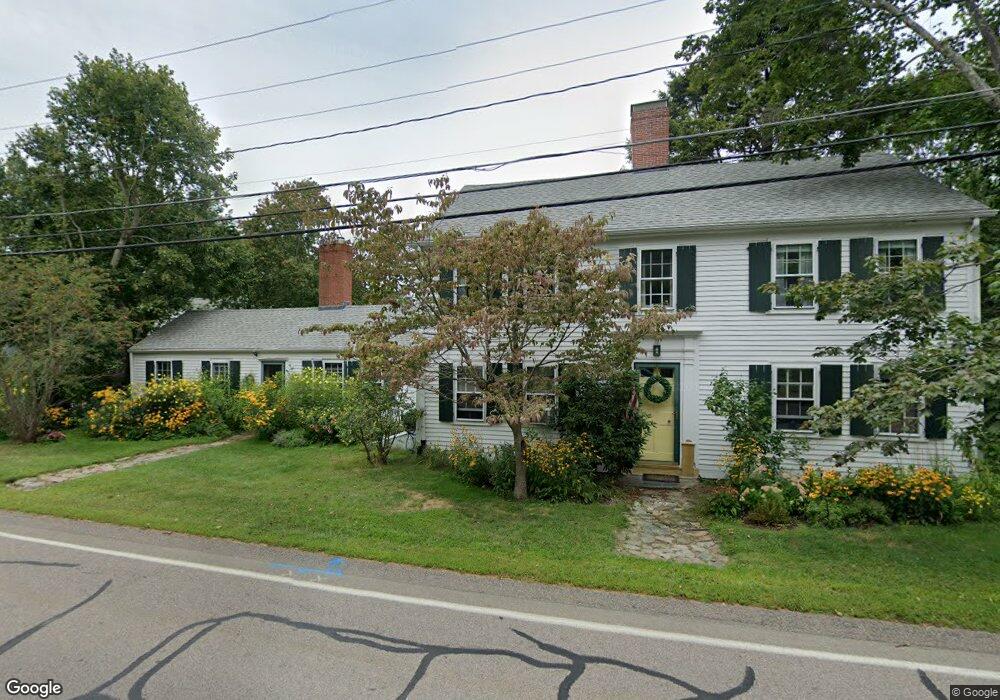
1007 West St Walpole, MA 02081
Walpole AreaEstimated Value: $886,000 - $983,000
About This Home
This home is located at 1007 West St, Walpole, MA 02081 and is currently estimated at $942,326, approximately $404 per square foot. 1007 West St is a home located in Norfolk County with nearby schools including Elm Street School, Eleanor N. Johnson Middle School, and Walpole High School.
Ownership History
We collect this data history from publicly available records. To have your information removed, we recommend requesting removal directly through your county’s website.
Purchase Details
Home Financials for this Owner
Home Financials are based on the most recent Mortgage that was taken out on this home.Home Values in the Area
Average Home Value in this Area
Purchase History
We collect this data history from publicly available records. To have your information removed, we recommend requesting removal directly through your county’s website.
| Date | Buyer | Sale Price | Title Company |
|---|---|---|---|
| -- | None Available |
Mortgage History
We collect this data history from publicly available records. To have your information removed, we recommend requesting removal directly through your county’s website.
| Date | Status | Borrower | Loan Amount |
|---|---|---|---|
| Open | $360,000 |
Tax History
We collect this data history from publicly available records. To have your information removed, we recommend requesting removal directly through your county’s website.
| Year | Tax Paid | Tax Assessment Tax Assessment Total Assessment is a certain percentage of the fair market value that is determined by local assessors to be the total taxable value of land and additions on the property. | Land | Improvement |
|---|---|---|---|---|
| 2025 | $11,292 | $880,100 | $398,300 | $481,800 |
| 2024 | $10,970 | $829,800 | $385,400 | $444,400 |
| 2023 | $10,341 | $744,500 | $338,200 | $406,300 |
| 2022 | $9,561 | $661,200 | $311,100 | $350,100 |
| 2021 | $9,066 | $610,900 | $291,800 | $319,100 |
| 2020 | $8,792 | $586,500 | $277,900 | $308,600 |
| 2019 | $8,470 | $560,900 | $269,700 | $291,200 |
| 2018 | $8,227 | $538,800 | $259,200 | $279,600 |
| 2017 | $8,007 | $522,300 | $251,000 | $271,300 |
| 2016 | $7,579 | $487,100 | $245,300 | $241,800 |
| 2015 | $7,395 | $471,000 | $235,600 | $235,400 |
| 2014 | $7,228 | $458,600 | $235,600 | $223,000 |
Map
- 21 Chandler Ave
- 18 Main St Unit 25
- 12 Brookside Ln
- 9 Brookside Ln
- 6 Tiger Terrace Unit 25
- 10 Weathervane Dr Unit 20
- 27 Thomas Mann Cir Unit 18
- 37 Thomas Mann Cir Unit 23
- 47 Thomas Mann Cir Unit 28
- 57 Thomas Mann Cir Unit 33
- 3 Granite St
- 3 Weathervane Dr Unit 1
- 9 Weathervane Dr Unit 45
- 530 West St Unit 1
- 10 Forrest Rd
- 16 Weathervane Dr Unit 23
- 18 Weathervane Dr Unit 24
- 85 Broad St
- 27 Cleary Cir Unit 27
- 99 Boardman St
Ask me questions while you tour the home.