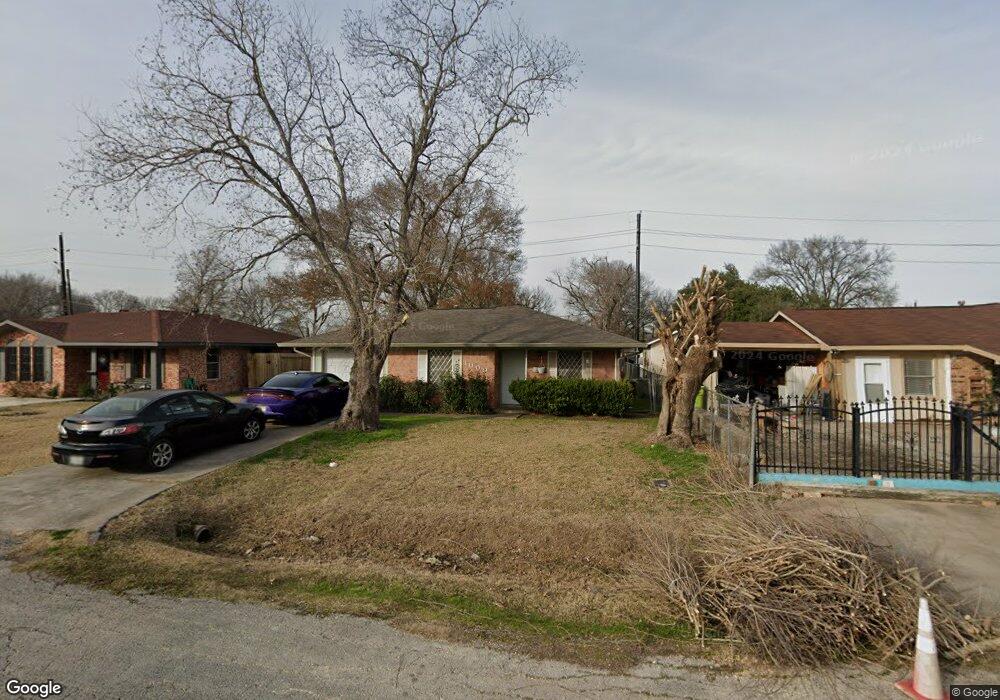
1009 Avenue D Rosenberg, TX 77471
Estimated Value: $139,000 - $163,000
1
Bed
2
Baths
997
Sq Ft
$151/Sq Ft
Est. Value
About This Home
This home is located at 1009 Avenue D, Rosenberg, TX 77471 and is currently estimated at $150,469, approximately $150 per square foot. 1009 Avenue D is a home located in Fort Bend County with nearby schools including Travis Elementary School, George Junior High School, and B.F. Terry High School.
Ownership History
Date
Name
Owned For
Owner Type
Purchase Details
Closed on
Nov 29, 2000
Sold by
Rodriguez Rogelio R and Rodriguez Olivia
Bought by
Gonzalez Noel
Current Estimated Value
Home Financials for this Owner
Home Financials are based on the most recent Mortgage that was taken out on this home.
Original Mortgage
$47,500
Outstanding Balance
$17,681
Interest Rate
7.84%
Estimated Equity
$132,788
Create a Home Valuation Report for This Property
The Home Valuation Report is an in-depth analysis detailing your home's value as well as a comparison with similar homes in the area
Home Values in the Area
Average Home Value in this Area
Purchase History
| Date | Buyer | Sale Price | Title Company |
|---|---|---|---|
| Gonzalez Noel | -- | First American Title |
Source: Public Records
Mortgage History
| Date | Status | Borrower | Loan Amount |
|---|---|---|---|
| Open | Gonzalez Noel | $47,500 |
Source: Public Records
Tax History
| Year | Tax Paid | Tax Assessment Tax Assessment Total Assessment is a certain percentage of the fair market value that is determined by local assessors to be the total taxable value of land and additions on the property. | Land | Improvement |
|---|---|---|---|---|
| 2025 | $3,346 | $159,397 | $49,500 | $109,897 |
| 2024 | $3,346 | $177,120 | $49,500 | $127,620 |
| 2023 | $3,694 | $191,353 | $63,360 | $127,993 |
| 2022 | $3,333 | $162,740 | $63,360 | $99,380 |
| 2021 | $2,844 | $137,050 | $63,360 | $73,690 |
| 2020 | $2,941 | $138,570 | $63,360 | $75,210 |
| 2019 | $2,141 | $93,720 | $20,060 | $73,660 |
| 2018 | $1,153 | $49,670 | $20,060 | $29,610 |
| 2017 | $1,136 | $48,660 | $20,060 | $28,600 |
| 2016 | $1,137 | $48,700 | $20,060 | $28,640 |
| 2015 | $1,168 | $49,790 | $20,060 | $29,730 |
| 2014 | $1,165 | $49,040 | $20,060 | $28,980 |
Source: Public Records
Map
Nearby Homes
Your Personal Tour Guide
Ask me questions while you tour the home.