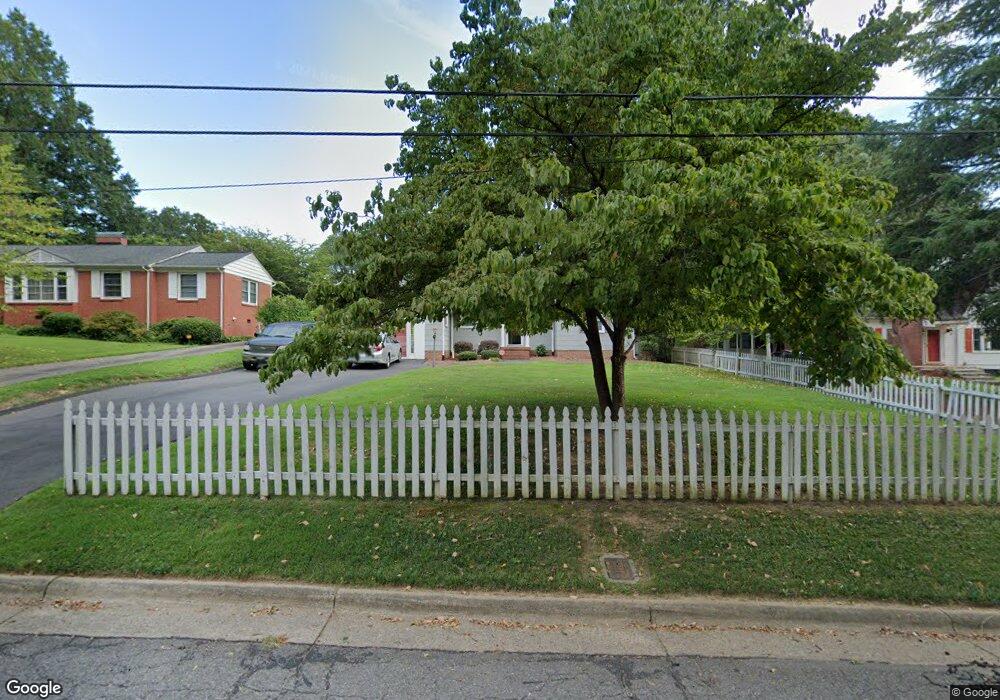
1009 E Maple Ave Gastonia, NC 28054
Estimated Value: $316,000 - $350,437
2
Beds
2
Baths
1,215
Sq Ft
$272/Sq Ft
Est. Value
About This Home
This home is located at 1009 E Maple Ave, Gastonia, NC 28054 and is currently estimated at $330,479, approximately $271 per square foot. 1009 E Maple Ave is a home located in Gaston County with nearby schools including Sherwood Elementary School, W P Grier Middle School, and Ashbrook High School.
Ownership History
Date
Name
Owned For
Owner Type
Purchase Details
Closed on
Aug 31, 2022
Sold by
Danner Garmon Larry and Danner Christine
Bought by
Hall Curtis Dandre and Hall Sunshyne Danner
Current Estimated Value
Purchase Details
Closed on
Mar 12, 2014
Sold by
Saunders Christopher and Saunders Jennifer
Bought by
Danner Carmon Larry and Danner Christine
Purchase Details
Closed on
Mar 31, 2004
Sold by
Bryant Matthew K and Bryant Kristy W
Bought by
Saunders Christopher and Saunders Jennifer
Home Financials for this Owner
Home Financials are based on the most recent Mortgage that was taken out on this home.
Original Mortgage
$103,000
Interest Rate
5.53%
Mortgage Type
Purchase Money Mortgage
Purchase Details
Closed on
Dec 19, 2001
Sold by
Seabrook William B
Bought by
Bryant Matthew K
Home Financials for this Owner
Home Financials are based on the most recent Mortgage that was taken out on this home.
Original Mortgage
$101,000
Interest Rate
6.42%
Create a Home Valuation Report for This Property
The Home Valuation Report is an in-depth analysis detailing your home's value as well as a comparison with similar homes in the area
Home Values in the Area
Average Home Value in this Area
Purchase History
| Date | Buyer | Sale Price | Title Company |
|---|---|---|---|
| Hall Curtis Dandre | -- | -- | |
| Danner Carmon Larry | $88,000 | None Available | |
| Saunders Christopher | $103,000 | -- | |
| Bryant Matthew K | $101,000 | -- |
Source: Public Records
Mortgage History
| Date | Status | Borrower | Loan Amount |
|---|---|---|---|
| Previous Owner | Saunders Christopher | $103,000 | |
| Previous Owner | Bryant Matthew K | $101,000 |
Source: Public Records
Tax History
| Year | Tax Paid | Tax Assessment Tax Assessment Total Assessment is a certain percentage of the fair market value that is determined by local assessors to be the total taxable value of land and additions on the property. | Land | Improvement |
|---|---|---|---|---|
| 2025 | $4,159 | $389,080 | $20,000 | $369,080 |
| 2024 | $3,278 | $306,630 | $20,000 | $286,630 |
| 2023 | $2,505 | $231,940 | $20,000 | $211,940 |
| 2022 | $1,527 | $114,780 | $15,000 | $99,780 |
| 2021 | $1,550 | $114,780 | $15,000 | $99,780 |
| 2019 | $1,545 | $113,590 | $15,000 | $98,590 |
| 2018 | $1,300 | $92,871 | $14,400 | $78,471 |
| 2017 | $1,216 | $86,889 | $14,400 | $72,489 |
| 2016 | $1,216 | $86,889 | $0 | $0 |
| 2014 | $1,337 | $95,511 | $18,000 | $77,511 |
Source: Public Records
Map
Nearby Homes
- 408 Elizabeth St
- 907 E 4th Ave
- 691 Carlton Dr
- 731 E 3rd Ave
- 617 E Garrison Blvd
- 815 E Second Ave
- 1004 E 8th Ave
- 934 S Chestnut St
- 943 Laurel Ln
- 855 Nottingham Dr Unit 65
- 921 Nottingham Dr Unit 6
- 1040 Laurel Ln
- 109 N Belvedere Ave
- 1605 Fairfield Dr
- 1212 E Franklin Blvd Unit D
- 1079 Laurel Ln Unit 6
- 1009 E Airline Ave
- 120 N Belvedere Ave
- 1339 Carmen Ln
- 1021 E Airline Ave
- 1007 E Maple Ave
- 1011 E Maple Ave
- 1014 Temple Ct
- 1005 E Maple Ave
- 1013 E Maple Ave
- 1010 E Maple Ave
- 1012 E Maple Ave
- 1008 E Maple Ave
- 1003 E Maple Ave
- 1004 E Maple Ave Unit 12
- 1016 Temple Ct
- 918 E 4th Ave
- 916 E 4th Ave
- 1015 Temple Ct
- 1001 E Maple Ave
- 416 Elizabeth St
- 1018 Temple Ct
- 1013 Woodland Dr
- 414 Elizabeth St
- 1011 Woodland Dr
Your Personal Tour Guide
Ask me questions while you tour the home.