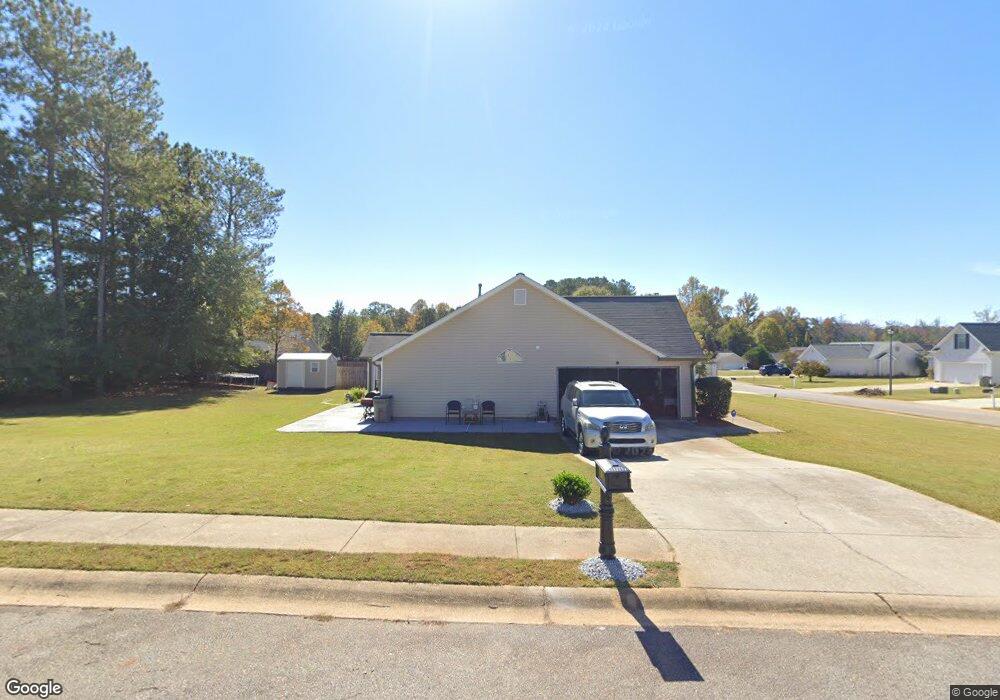
101 Belmont Ct Lagrange, GA 30241
Estimated Value: $236,021 - $254,000
3
Beds
2
Baths
1,298
Sq Ft
$189/Sq Ft
Est. Value
About This Home
This home is located at 101 Belmont Ct, Lagrange, GA 30241 and is currently estimated at $245,255, approximately $188 per square foot. 101 Belmont Ct is a home located in Troup County with nearby schools including Whitesville Road Elementary School, Berta Weathersbee Elementary School, and Rosemont Elementary School.
Ownership History
Date
Name
Owned For
Owner Type
Purchase Details
Closed on
Jan 9, 2006
Sold by
David Lindsey Homes Inc
Bought by
Copeland Zenobia S
Current Estimated Value
Home Financials for this Owner
Home Financials are based on the most recent Mortgage that was taken out on this home.
Original Mortgage
$135,441
Outstanding Balance
$74,582
Interest Rate
6.22%
Mortgage Type
FHA
Estimated Equity
$170,673
Purchase Details
Closed on
Mar 25, 2004
Bought by
Neely Homes Inc
Create a Home Valuation Report for This Property
The Home Valuation Report is an in-depth analysis detailing your home's value as well as a comparison with similar homes in the area
Purchase History
We collect this data history from publicly available records. To have your information removed, we recommend requesting removal directly through your county’s website.
| Date | Buyer | Sale Price | Title Company |
|---|---|---|---|
| Copeland Zenobia S | $137,567 | -- | |
| Neely Homes Inc | -- | -- |
Source: Public Records
Mortgage History
We collect this data history from publicly available records. To have your information removed, we recommend requesting removal directly through your county’s website.
| Date | Status | Borrower | Loan Amount |
|---|---|---|---|
| Open | Copeland Zenobia S | $135,441 |
Source: Public Records
Tax History
| Year | Tax Paid | Tax Assessment Tax Assessment Total Assessment is a certain percentage of the fair market value that is determined by local assessors to be the total taxable value of land and additions on the property. | Land | Improvement |
|---|---|---|---|---|
| 2025 | $2,556 | $93,720 | $18,000 | $75,720 |
| 2024 | $2,295 | $84,160 | $18,000 | $66,160 |
| 2023 | $1,682 | $61,680 | $14,000 | $47,680 |
| 2022 | $1,637 | $58,640 | $14,000 | $44,640 |
| 2021 | $1,550 | $51,400 | $10,000 | $41,400 |
| 2020 | $1,437 | $47,640 | $10,000 | $37,640 |
| 2019 | $1,425 | $47,240 | $10,000 | $37,240 |
| 2018 | $1,425 | $47,240 | $10,000 | $37,240 |
| 2017 | $1,374 | $45,560 | $10,600 | $34,960 |
| 2016 | $1,354 | $44,895 | $10,600 | $34,295 |
| 2015 | $1,356 | $44,895 | $10,600 | $34,295 |
| 2014 | $1,304 | $43,090 | $10,600 | $32,490 |
| 2013 | -- | $41,669 | $10,600 | $31,069 |
Source: Public Records
Map
Nearby Homes
- 312 Preakness Dr
- 101 Beaver Creek Way
- 101 Beaver Creek Way Unit 246
- 103 Beaver Creek Way
- 103 Beaver Creek Way Unit 247
- 100 Beaver Creek Way Unit 266
- 100 Beaver Creek Way
- 102 Beaver Creek Way
- 102 Beaver Creek Way Unit 265
- 104 Beaver Creek Way
- 104 Beaver Creek Way Unit 264
- 436 Lakeview Dr
- 436 Lakeview Way Unit 269
- 436 Lakeview Way
- 438 Lakeview Way
- 438 Lakeview Way Unit 268
- 438 Lakeview Dr
- 434 Lakeview Dr
- 434 Lakeview Way
- 434 Lakeview Way Unit 270
- 105 Preakness Dr
- 201 Preakness Dr
- 103 Belmont Ct
- 402 Baldwin Park Dr
- 402 Baldwin Park Dr Unit 66
- 106 Preakness Dr
- 404 Baldwin Park Dr
- 404 Baldwin Park Dr Unit 67
- 108 Preakness Dr
- 203 Preakness Dr
- 203 Preakness Dr Unit 58
- 104 Preakness Dr
- 104 Belmont Ct
- 105 Belmont Ct
- 200 Preakness Dr
- 406 Baldwin Park Dr
- 102 Preakness Dr
- 106 Belmont Ct
- 303 Lexington Park Dr
- 303 Boston Dr
Your Personal Tour Guide
Ask me questions while you tour the home.