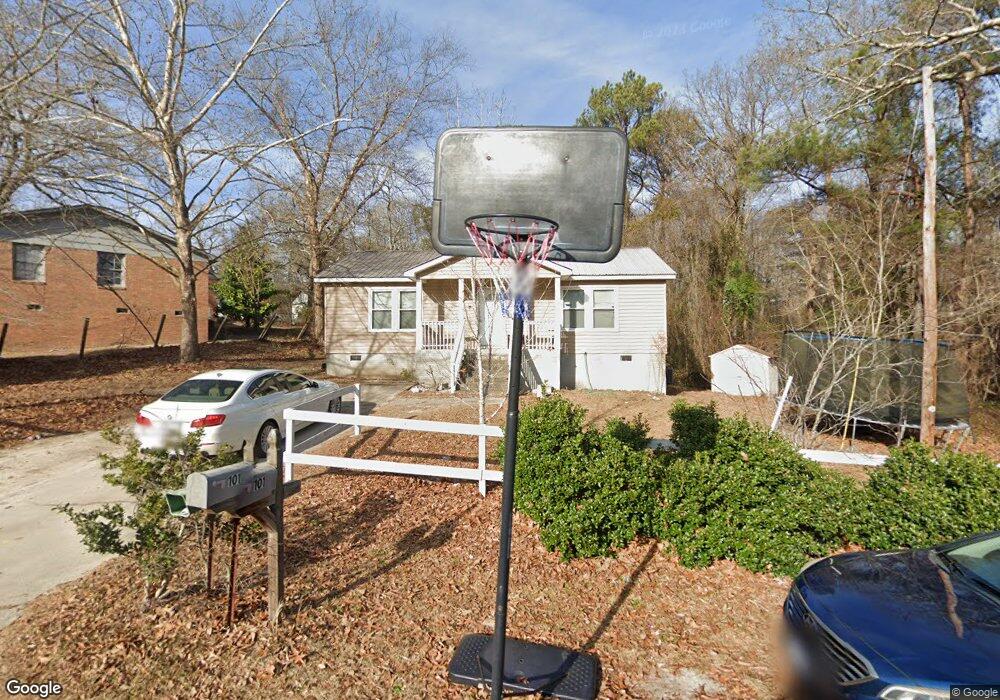
101 Charmont Dr Columbia, SC 29223
Spring Valley NeighborhoodEstimated Value: $109,000 - $151,000
3
Beds
2
Baths
1,000
Sq Ft
$132/Sq Ft
Est. Value
About This Home
This home is located at 101 Charmont Dr, Columbia, SC 29223 and is currently estimated at $131,929, approximately $131 per square foot. 101 Charmont Dr is a home located in Richland County with nearby schools including L. B. Nelson Elementary School, E. L. Wright Middle School, and Westwood High School.
Ownership History
Date
Name
Owned For
Owner Type
Purchase Details
Closed on
Dec 3, 2015
Sold by
Allnutt Tommy E
Bought by
Davis O Smith Residual Trust and Inman
Current Estimated Value
Purchase Details
Closed on
Sep 8, 2015
Sold by
Barkoot Katherine
Bought by
Allnutt Tommy E
Purchase Details
Closed on
Oct 22, 2014
Sold by
Allnutt Mary A and Allnutt David E
Bought by
Barkoot Katherine
Purchase Details
Closed on
Apr 14, 2010
Sold by
Allnutt David E
Bought by
Allnutt David E and Allnutt Mary Ann
Home Financials for this Owner
Home Financials are based on the most recent Mortgage that was taken out on this home.
Original Mortgage
$52,800
Interest Rate
4.94%
Mortgage Type
New Conventional
Purchase Details
Closed on
Jul 29, 1999
Sold by
Clark Melody A
Bought by
Allnutt David E
Home Financials for this Owner
Home Financials are based on the most recent Mortgage that was taken out on this home.
Original Mortgage
$61,100
Interest Rate
7.66%
Create a Home Valuation Report for This Property
The Home Valuation Report is an in-depth analysis detailing your home's value as well as a comparison with similar homes in the area
Home Values in the Area
Average Home Value in this Area
Purchase History
| Date | Buyer | Sale Price | Title Company |
|---|---|---|---|
| Davis O Smith Residual Trust | $20,000 | -- | |
| Allnutt Tommy E | $14,807 | -- | |
| Barkoot Katherine | $28,769 | -- | |
| Allnutt David E | -- | -- | |
| Allnutt David E | $63,000 | -- |
Source: Public Records
Mortgage History
| Date | Status | Borrower | Loan Amount |
|---|---|---|---|
| Previous Owner | Allnutt David E | $52,800 | |
| Previous Owner | Allnutt David E | $61,100 |
Source: Public Records
Tax History
| Year | Tax Paid | Tax Assessment Tax Assessment Total Assessment is a certain percentage of the fair market value that is determined by local assessors to be the total taxable value of land and additions on the property. | Land | Improvement |
|---|---|---|---|---|
| 2024 | $759 | $42,900 | $0 | $0 |
| 2023 | $736 | $1,492 | $0 | $0 |
| 2022 | $661 | $37,300 | $6,600 | $30,700 |
| 2021 | $642 | $1,490 | $0 | $0 |
| 2020 | $647 | $1,490 | $0 | $0 |
| 2019 | $613 | $1,490 | $0 | $0 |
| 2018 | $686 | $1,920 | $0 | $0 |
| 2017 | $677 | $1,920 | $0 | $0 |
| 2016 | $675 | $1,920 | $0 | $0 |
| 2015 | $850 | $2,720 | $0 | $0 |
| 2014 | $522 | $31,100 | $0 | $0 |
| 2013 | -- | $1,240 | $0 | $0 |
Source: Public Records
Map
Nearby Homes
- 97 Charmont Dr
- 101 Rabon Springs Rd
- 113 Rabon Springs Rd
- 94 Winterberry Ln
- 224 Foxhunt Rd
- 337 Valley Heights Ln
- 1193 Rabon Pond Dr
- 776 Blazing Star Trail
- 134 Brookspring Rd
- 217 S Shields Rd
- 1253 Rabon Pond Dr
- 209 Brookspring Rd
- N/S Rabon Rd
- 100 Dale Valley Rd
- 155 Lionsgate Dr
- 1306 Rabon Pond Dr
- 73 Olde Springs Rd
- 282 Brando Way
- 280 Brando Way
- 278 Brando Way
- 100 Westbridge Rd
- 104 Westbridge Rd
- 108 Westbridge Rd
- 104 Charmont Dr
- 108 Charmont Dr
- 95 Charmont Dr
- 112 Charmont Dr
- 105 Westbridge Rd
- 112 Westbridge Rd
- 93 Charmont Dr
- 109 Westbridge Rd
- 116 Westbridge Rd
- 120 Charmont Dr
- 91 Charmont Dr
- 113 Westbridge Rd
- 120 Westbridge Rd
- 124 Charmont Dr
- 89 Charmont Dr
- 117 Westbridge Rd
- 129 Charmont Dr
Your Personal Tour Guide
Ask me questions while you tour the home.