101 Killingly St Providence, RI 02909
Hartford NeighborhoodEstimated Value: $365,973 - $413,000
About This Home
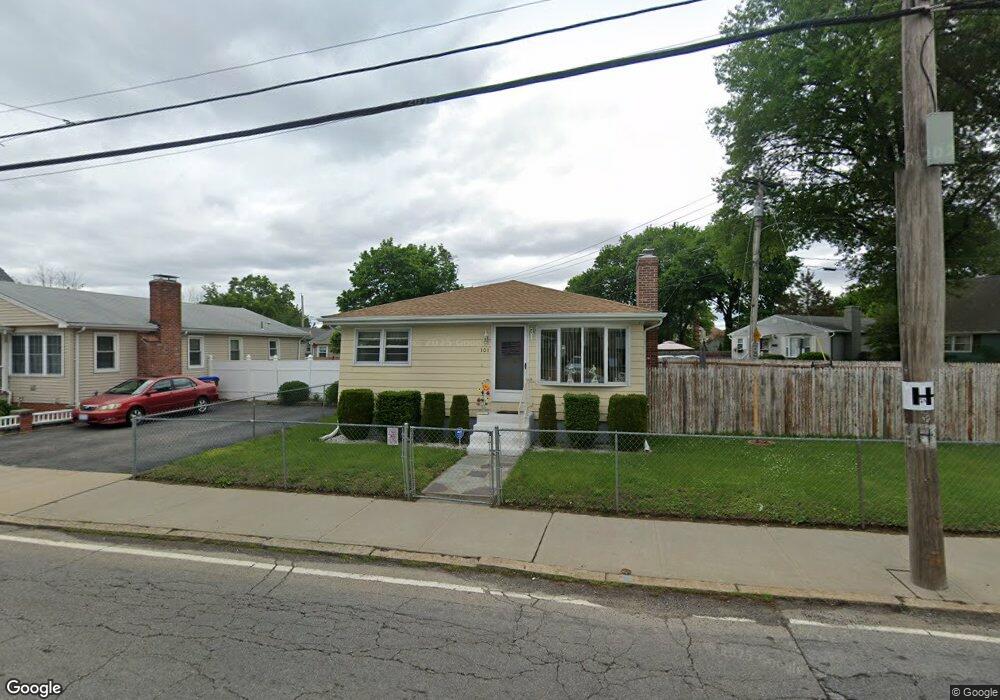
This home is located at 101 Killingly St, Providence, RI 02909 and is currently estimated at $387,493, approximately $341 per square foot. 101 Killingly St is a home located in Providence County with nearby schools including Achievement First Promesa, Achievement First Providence Mayoral Academy Elementary School, and Achievement First Providence Mayoral Academy Elementary.
Ownership History
We collect this data history from publicly available records. To have your information removed, we recommend requesting removal directly through your county’s website.
Purchase Details
Home Values in the Area
Average Home Value in this Area
Purchase History
We collect this data history from publicly available records. To have your information removed, we recommend requesting removal directly through your county’s website.
| Date | Buyer | Sale Price | Title Company |
|---|---|---|---|
| $80,000 | -- |
Mortgage History
We collect this data history from publicly available records. To have your information removed, we recommend requesting removal directly through your county’s website.
| Date | Status | Borrower | Loan Amount |
|---|---|---|---|
| Open | $20,000 | ||
| Closed | $18,000 | ||
| Open | $133,100 | ||
| Closed | $94,400 |
Tax History
We collect this data history from publicly available records. To have your information removed, we recommend requesting removal directly through your county’s website.
| Year | Tax Paid | Tax Assessment Tax Assessment Total Assessment is a certain percentage of the fair market value that is determined by local assessors to be the total taxable value of land and additions on the property. | Land | Improvement |
|---|---|---|---|---|
| 2025 | $2,794 | $332,600 | $137,400 | $195,200 |
| 2024 | $4,712 | $256,800 | $86,900 | $169,900 |
| 2023 | $4,712 | $256,800 | $86,900 | $169,900 |
| 2022 | $4,571 | $256,800 | $86,900 | $169,900 |
| 2021 | $4,254 | $173,200 | $50,900 | $122,300 |
| 2020 | $4,254 | $173,200 | $50,900 | $122,300 |
| 2019 | $4,254 | $173,200 | $50,900 | $122,300 |
| 2018 | $3,992 | $124,900 | $43,400 | $81,500 |
| 2017 | $3,992 | $124,900 | $43,400 | $81,500 |
| 2016 | $3,992 | $124,900 | $43,400 | $81,500 |
| 2015 | $3,803 | $114,900 | $43,400 | $71,500 |
| 2014 | $3,878 | $114,900 | $43,400 | $71,500 |
| 2013 | $3,878 | $114,900 | $43,400 | $71,500 |
Map
- 36 Duxbury St
- 665 Plainfield St
- 110 Petteys Ave
- 219 Lowell Ave
- 231 Lowell Ave
- 37 Mercy St
- 104 Alverson Ave
- 19 Legion Memorial Dr
- 89 Dedham Ave
- 25 Lecia Dr
- 24 Jacqueline Dr
- 240 Eastwood Ave
- 85 Sunset Ave
- 243 Killingly St
- 35 Myra St
- 14 Seton St
- 60 Ophelia St
- 35 Lawrence St
- 0 Central Ave Unit 1406483
- 705 Union Ave
- 82 Killingly St
- 78 Killingly St
- 90 Killingly St
- 16 Duxbury St
- 68 Killingly St
- 94 Killingly St
- 79 Killingly St
- 98 Killingly St
- 69 Killingly St
- 16 Dedham Ave
- 7 Eliza St
- 28 Duxbury St
- 105 Killingly St
- 112 Killingly St
- 20 Dedham Ave
- 58 Killingly St
- 63 Killingly St
- 111 Killingly St
- 11 Eliza St
- 9 Duxbury St
Ask me questions while you tour the home.