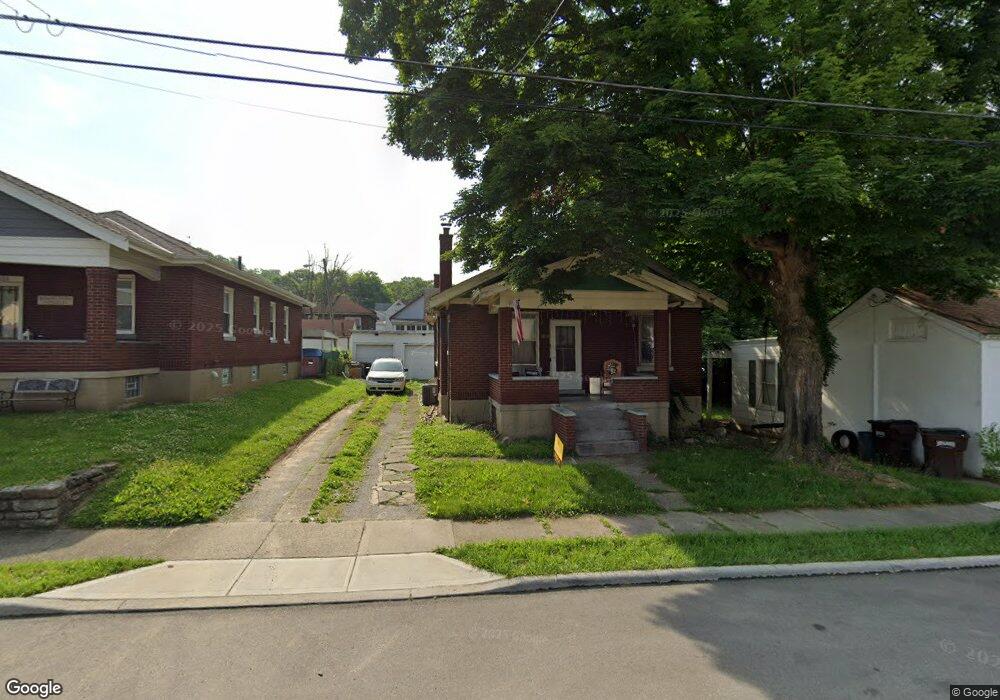
1010 3rd St Cincinnati, OH 45215
Estimated Value: $148,000 - $197,000
3
Beds
2
Baths
1,378
Sq Ft
$125/Sq Ft
Est. Value
About This Home
This home is located at 1010 3rd St, Cincinnati, OH 45215 and is currently estimated at $172,929, approximately $125 per square foot. 1010 3rd St is a home located in Hamilton County with nearby schools including Reading Community High School, Saints Peter and Paul Academy, and Mount Notre Dame High School.
Ownership History
Date
Name
Owned For
Owner Type
Purchase Details
Closed on
Nov 26, 2010
Sold by
Haverkos Robert Lawrence and Haverkos Sarah Marie
Bought by
Haverkos Steven L and Mari Kathryn R
Current Estimated Value
Purchase Details
Closed on
Apr 27, 2010
Sold by
Haverkos Steven L and Haverkos Steven
Bought by
Haverkos Robert Lawrence and Haverkos Sarah Marie
Create a Home Valuation Report for This Property
The Home Valuation Report is an in-depth analysis detailing your home's value as well as a comparison with similar homes in the area
Home Values in the Area
Average Home Value in this Area
Purchase History
| Date | Buyer | Sale Price | Title Company |
|---|---|---|---|
| Haverkos Steven L | -- | Attorney | |
| Haverkos Robert Lawrence | -- | Attorney |
Source: Public Records
Tax History
| Year | Tax Paid | Tax Assessment Tax Assessment Total Assessment is a certain percentage of the fair market value that is determined by local assessors to be the total taxable value of land and additions on the property. | Land | Improvement |
|---|---|---|---|---|
| 2025 | $1,927 | $35,501 | $8,736 | $26,765 |
| 2024 | $1,928 | $35,501 | $8,736 | $26,765 |
| 2023 | $1,924 | $35,501 | $8,736 | $26,765 |
| 2022 | $1,518 | $21,757 | $7,025 | $14,732 |
| 2021 | $1,299 | $21,757 | $7,025 | $14,732 |
| 2020 | $1,281 | $21,757 | $7,025 | $14,732 |
| 2019 | $1,248 | $19,254 | $6,216 | $13,038 |
| 2018 | $1,249 | $19,254 | $6,216 | $13,038 |
| 2017 | $1,193 | $19,254 | $6,216 | $13,038 |
| 2016 | $1,568 | $25,113 | $6,587 | $18,526 |
| 2015 | $1,561 | $25,113 | $6,587 | $18,526 |
| 2014 | $1,371 | $25,113 | $6,587 | $18,526 |
| 2013 | $1,389 | $25,624 | $6,720 | $18,904 |
Source: Public Records
Map
Nearby Homes
Your Personal Tour Guide
Ask me questions while you tour the home.