Estimated Value: $264,681 - $425,000
About This Home
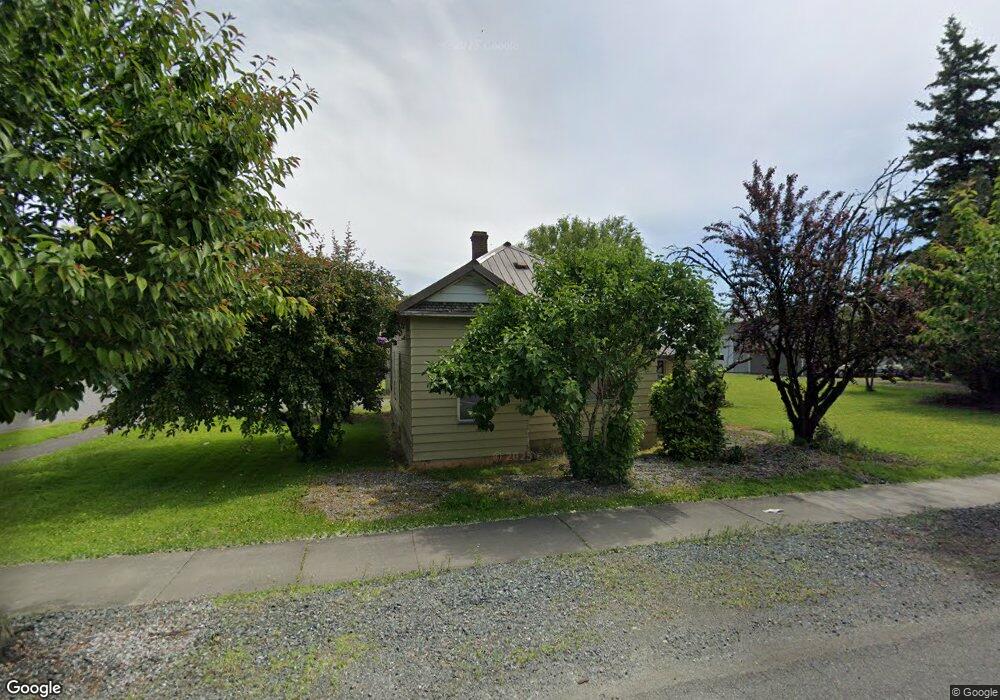
This 3-bedroom, 1-bath home in Sumas, WA offers comfortable living with off-street parking and a large yard ideal for outdoor use. The property is conveniently located near restaurants, grocery stores, and parks, making errands and recreation easy to access. Well-suited for those seeking a practical, well-situated residence in the area.
No Smoking
Application: $50.00 per adult 18+
Admin Fee: $175.00 (nonrefundable fee at move-in)
Rent: $1,600.00
Tenant responsible for all utilities. Base: Water/Sewer/Garbage will be billed in the form of a utility fee. $120/m+ (Subject to rates at time of move-in).
Deposit: $1,600.00
Tenant is responsible for all yard care.
You must see the property before we can accept an application. Once you've seen the property, you have the option to apply. All applications are done electronically.
Mission Realty LLC does not accept reusable tenant screening reports.
Approved applicants must begin their lease within 14 days of approval. A non-refundable holding deposit equal to 25% of one month’s rent is due within 48 hours to secure the unit and will be applied toward the first month's rent. This requirement does not apply until the unit is vacant and inspected.
Property History
We collect this data history from publicly available records. To have your information removed, we recommend requesting removal directly through your county’s website.
| Date | Event | Price | List to Sale | Price per Sq Ft |
|---|---|---|---|---|
| 06/25/2026 06/25/26 | For Rent | $1,600 | -- | -- |
Tax History
We collect this data history from publicly available records. To have your information removed, we recommend requesting removal directly through your county’s website.
| Year | Tax Paid | Tax Assessment Tax Assessment Total Assessment is a certain percentage of the fair market value that is determined by local assessors to be the total taxable value of land and additions on the property. | Land | Improvement |
|---|---|---|---|---|
| 2025 | $1,924 | $203,195 | $117,005 | $86,190 |
| 2024 | $1,858 | $201,093 | $117,005 | $84,088 |
| 2023 | $1,858 | $192,842 | $103,308 | $89,534 |
| 2022 | $1,650 | $173,734 | $93,072 | $80,662 |
| 2021 | $1,569 | $143,584 | $76,920 | $66,664 |
| 2020 | $1,505 | $116,738 | $62,538 | $54,200 |
| 2019 | $1,251 | $116,738 | $62,538 | $54,200 |
| 2018 | $1,198 | $112,000 | $60,000 | $52,000 |
| 2017 | $1,066 | $81,136 | $41,760 | $39,376 |
| 2016 | $1,017 | $74,862 | $38,520 | $36,342 |
| 2015 | $914 | $71,943 | $37,152 | $34,791 |
| 2014 | -- | $69,712 | $36,000 | $33,712 |
| 2013 | -- | $69,712 | $36,000 | $33,712 |
Map
- 226 Morton St
- 232 Front St
- 0 Washington 547
- 319 Vancouver St
- 310 Second St
- 517 Lawson St
- 304 Sumas Ave
- 230 Cleveland Ave
- 0 Hill Rd
- 3650 E Badger Rd
- 9801 Lenhart Rd
- 4135 Kamphouse Dr
- 5419 Hillview Rd
- 4315 Nordum Rd
- 5326 Reese Hill Rd
- 0 Clearbrook Rd
- 8388 N Pass Rd
- 48 XX Reese Hill Rd
- 9007 Van Buren Rd
- 2654 Halverstick Rd
- 117 Mitchell St
- 1032 Cherry St
- 129 Mitchell St
- 110 Morton St
- 1042 Cherry St
- 128 Morton St
- 124 Mitchell St
- 1106 Cherry St
- 890 Cherry St
- 908 Cherry St
- 1011 Sumas Ave
- 1011 Sumas Ave Unit Ave
- 142 Mitchell St
- 123 Vancouver St
- 127 Morton St
- 1041 Sumas Ave
- 143 Vancouver St
- 133 Morton St
- 1018 Sumas Ave
- 1109 Sumas Ave
Ask me questions while you tour the home.