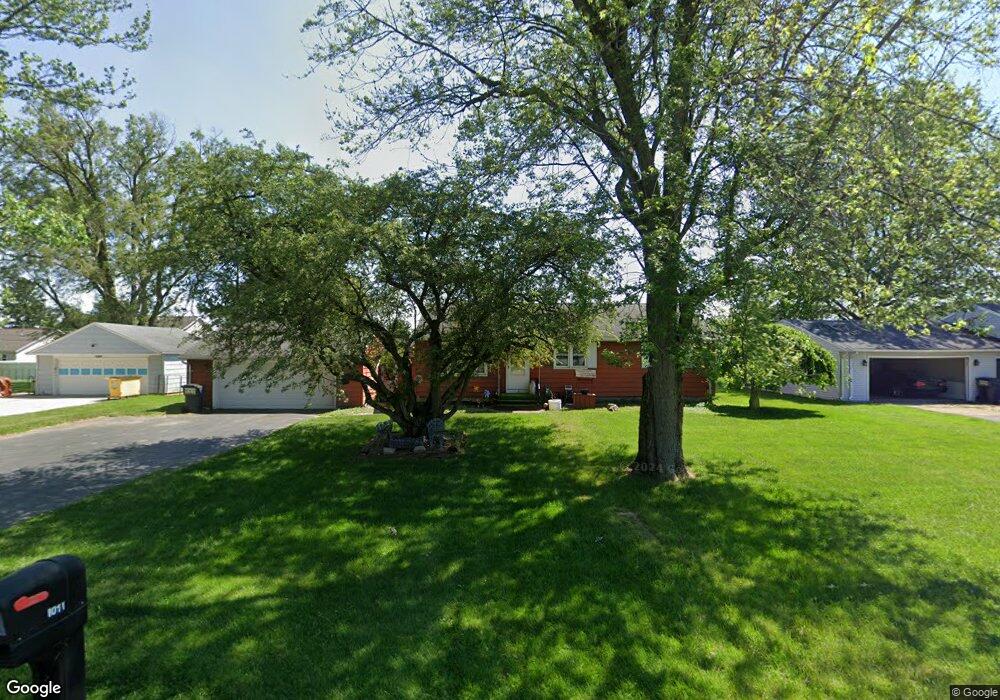
1011 E Cole Rd Fremont, OH 43420
Estimated Value: $201,000 - $225,000
3
Beds
2
Baths
1,336
Sq Ft
$158/Sq Ft
Est. Value
About This Home
This home is located at 1011 E Cole Rd, Fremont, OH 43420 and is currently estimated at $210,778, approximately $157 per square foot. 1011 E Cole Rd is a home located in Sandusky County with nearby schools including Fremont Ross High School, Sacred Heart School, and Temple Christian Academy.
Ownership History
Date
Name
Owned For
Owner Type
Purchase Details
Closed on
Jun 21, 2018
Sold by
Pocock Carol S
Bought by
Pocock Carol S and Pocock Michael A
Current Estimated Value
Purchase Details
Closed on
Jun 10, 2016
Sold by
Pocock Kenneth E
Bought by
Carol S Pocock
Home Financials for this Owner
Home Financials are based on the most recent Mortgage that was taken out on this home.
Interest Rate
3.6%
Purchase Details
Closed on
Oct 14, 2014
Sold by
Pocock Kenneth E and Pocock Carol S
Bought by
Pocock Kenneth E and Pocock Carol S
Create a Home Valuation Report for This Property
The Home Valuation Report is an in-depth analysis detailing your home's value as well as a comparison with similar homes in the area
Home Values in the Area
Average Home Value in this Area
Purchase History
| Date | Buyer | Sale Price | Title Company |
|---|---|---|---|
| Pocock Carol S | -- | None Available | |
| Carol S Pocock | -- | -- | |
| Pocock Kenneth E | -- | Attorney |
Source: Public Records
Mortgage History
| Date | Status | Borrower | Loan Amount |
|---|---|---|---|
| Closed | Carol S Pocock | -- |
Source: Public Records
Tax History
| Year | Tax Paid | Tax Assessment Tax Assessment Total Assessment is a certain percentage of the fair market value that is determined by local assessors to be the total taxable value of land and additions on the property. | Land | Improvement |
|---|---|---|---|---|
| 2025 | $1,846 | $169,900 | $34,700 | $135,200 |
| 2024 | $1,846 | $59,470 | $12,150 | $47,320 |
| 2023 | $1,937 | $49,570 | $10,120 | $39,450 |
| 2022 | $1,701 | $49,570 | $10,120 | $39,450 |
| 2021 | $1,753 | $49,570 | $10,120 | $39,450 |
| 2020 | $1,468 | $42,250 | $10,120 | $32,130 |
| 2019 | $1,467 | $42,250 | $10,120 | $32,130 |
| 2018 | $1,288 | $42,250 | $10,120 | $32,130 |
| 2017 | $1,148 | $35,530 | $10,120 | $25,410 |
| 2016 | $1,006 | $35,530 | $10,120 | $25,410 |
| 2015 | $990 | $35,530 | $10,120 | $25,410 |
| 2014 | $1,099 | $37,250 | $9,910 | $27,340 |
| 2013 | $1,075 | $37,250 | $9,910 | $27,340 |
Source: Public Records
Map
Nearby Homes
- 1250 Morrison Rd
- 64 River Run Dr
- 1720 Tiffin Rd
- 1517 Tiffin Rd
- 748 S Front St
- 746 S Front St
- 925 Woodland St
- 1440 W Cole Rd
- 411 S Collinwood Blvd
- 515 S Arch St
- 0 E State St Unit 20260933
- 0 E State St Unit 20260876
- 1485 Autumn Woods Dr
- 123 N Prospect St
- 1116 Buckland Ave
- 208 E State St
- 1719 Buckland Ave
- 1106 Timpe Rd
- 1310 Mcpherson Blvd
- 322 4th St
Your Personal Tour Guide
Ask me questions while you tour the home.