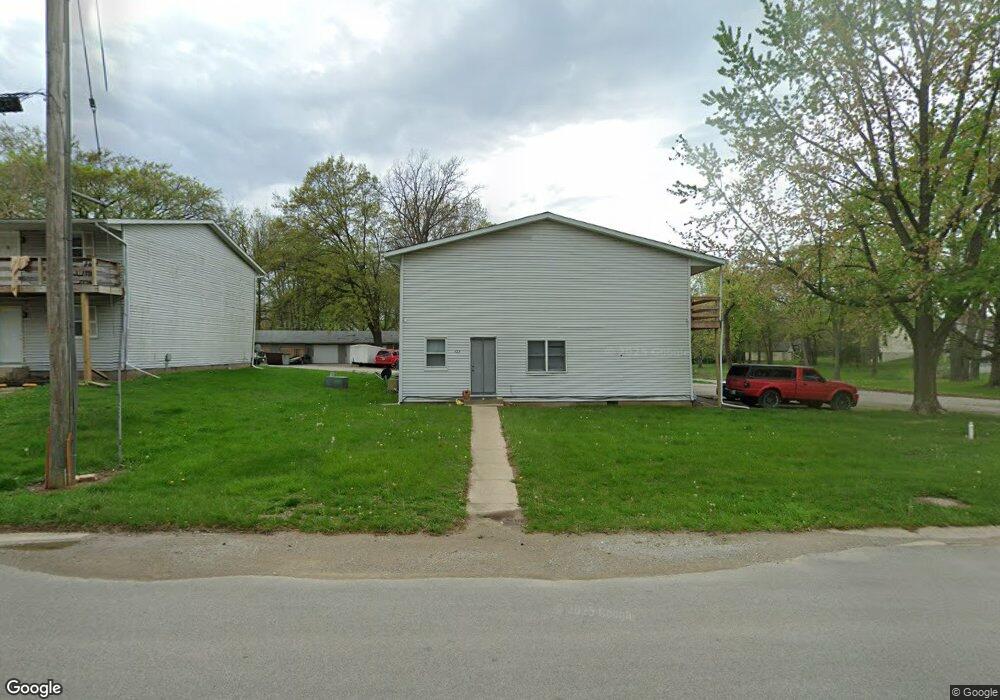
1013 N 5th St Riverton, IL 62561
Estimated Value: $156,271
1
Bed
1
Bath
576
Sq Ft
$271/Sq Ft
Est. Value
About This Home
This home is located at 1013 N 5th St, Riverton, IL 62561 and is currently estimated at $156,271, approximately $271 per square foot. 1013 N 5th St is a home located in Sangamon County with nearby schools including Riverton Middle School and Riverton High School.
Ownership History
Date
Name
Owned For
Owner Type
Purchase Details
Closed on
Jan 26, 2021
Sold by
R & L Holdings 1 Inc
Bought by
Ten Nine Thirteen Fifth Land Trust
Current Estimated Value
Home Financials for this Owner
Home Financials are based on the most recent Mortgage that was taken out on this home.
Original Mortgage
$248,000
Outstanding Balance
$224,647
Interest Rate
3.85%
Mortgage Type
New Conventional
Estimated Equity
-$68,376
Purchase Details
Closed on
Jan 22, 2021
Sold by
R & L Holdings 1 Inc
Bought by
Ten Nine Thirteen Fifth Land Trust
Home Financials for this Owner
Home Financials are based on the most recent Mortgage that was taken out on this home.
Original Mortgage
$248,000
Outstanding Balance
$224,647
Interest Rate
3.85%
Mortgage Type
New Conventional
Estimated Equity
-$68,376
Purchase Details
Closed on
Dec 18, 2019
Sold by
Giganti Rentals Inc
Bought by
R & L Holdings 1 Inc
Purchase Details
Closed on
Jan 21, 2004
Create a Home Valuation Report for This Property
The Home Valuation Report is an in-depth analysis detailing your home's value as well as a comparison with similar homes in the area
Home Values in the Area
Average Home Value in this Area
Purchase History
We collect this data history from publicly available records. To have your information removed, we recommend requesting removal directly through your county’s website.
| Date | Buyer | Sale Price | Title Company |
|---|---|---|---|
| Ten Nine Thirteen Fifth Land Trust | $310,000 | Prairie Land Title | |
| Ten Nine Thirteen Fifth Land Trust | $310,000 | Prairie Land Title | |
| R & L Holdings 1 Inc | $109,500 | Prairie Land Title | |
| -- | -- | -- |
Source: Public Records
Mortgage History
We collect this data history from publicly available records. To have your information removed, we recommend requesting removal directly through your county’s website.
| Date | Status | Borrower | Loan Amount |
|---|---|---|---|
| Open | Ten Nine Thirteen Fifth Land Trust | $248,000 | |
| Closed | Ten Nine Thirteen Fifth Land Trust | $248,000 |
Source: Public Records
Tax History
| Year | Tax Paid | Tax Assessment Tax Assessment Total Assessment is a certain percentage of the fair market value that is determined by local assessors to be the total taxable value of land and additions on the property. | Land | Improvement |
|---|---|---|---|---|
| 2024 | $3,962 | $58,965 | $8,019 | $50,946 |
| 2023 | $3,695 | $54,541 | $7,417 | $47,124 |
| 2022 | $3,674 | $50,764 | $6,903 | $43,861 |
| 2021 | $3,575 | $48,644 | $6,615 | $42,029 |
| 2020 | $5,508 | $76,205 | $6,572 | $69,633 |
| 2019 | $5,359 | $75,864 | $6,543 | $69,321 |
| 2018 | $5,160 | $74,457 | $6,422 | $68,035 |
| 2017 | $5,045 | $72,408 | $6,245 | $66,163 |
| 2016 | $4,928 | $70,183 | $6,053 | $64,130 |
| 2015 | $4,846 | $68,238 | $5,885 | $62,353 |
| 2014 | $4,736 | $67,170 | $5,793 | $61,377 |
| 2013 | $4,715 | $67,800 | $5,847 | $61,953 |
Source: Public Records
Map
Nearby Homes
- 901 N 6th St Unit 1
- 0 E Lincoln St
- 220 S 4th St Unit 1
- 16 Holiday Ln Unit 1
- 385 High Meadow
- 2676 Overpass Rd
- 5243 S Williamsville Rd Unit 1
- 5801 Oakcrest Rd
- 3413 Bissell Rd Unit BV9
- 7460 Rolling Oaks Dr Unit 1
- 1310 Carver Rd Unit 1
- 2630 Piper Ln Unit 1
- 8080 Breezy Meadows Dr
- 3136 Lakeshire Dr
- 9320 Dawson Ln
- 3319 Ridgewood Ave Unit Lot 46
- 1601 Ascot Chase
- 213 Pimlico Chase
- 01 Mechanicsburg Rd
- 1309 Arlington Chase
- 1009 & 1013 N 5th St
- 1009 N 5th St
- 1017 N 5th St
- 1003 N 5th St
- 1008 N 5th St
- 1012 N 5th St
- 425 E Spaulding St Unit 1
- 1001 N 5th St
- 415 E Spaulding St
- 501 E Spaulding St
- 1015 N 5th St
- 1014 N 5th St
- 20 Carl St
- 22 Carl St
- 505 E Spaulding St
- 1020 N 5th St
- 18 Carl St
- 409 E Spaulding St
- 401 E Spaulding St Unit 1
- 509 E Spaulding St Unit 1
Your Personal Tour Guide
Ask me questions while you tour the home.