1013 Riley St Lansing, MI 48910
Clifford Park NeighborhoodEstimated Value: $127,890 - $157,000
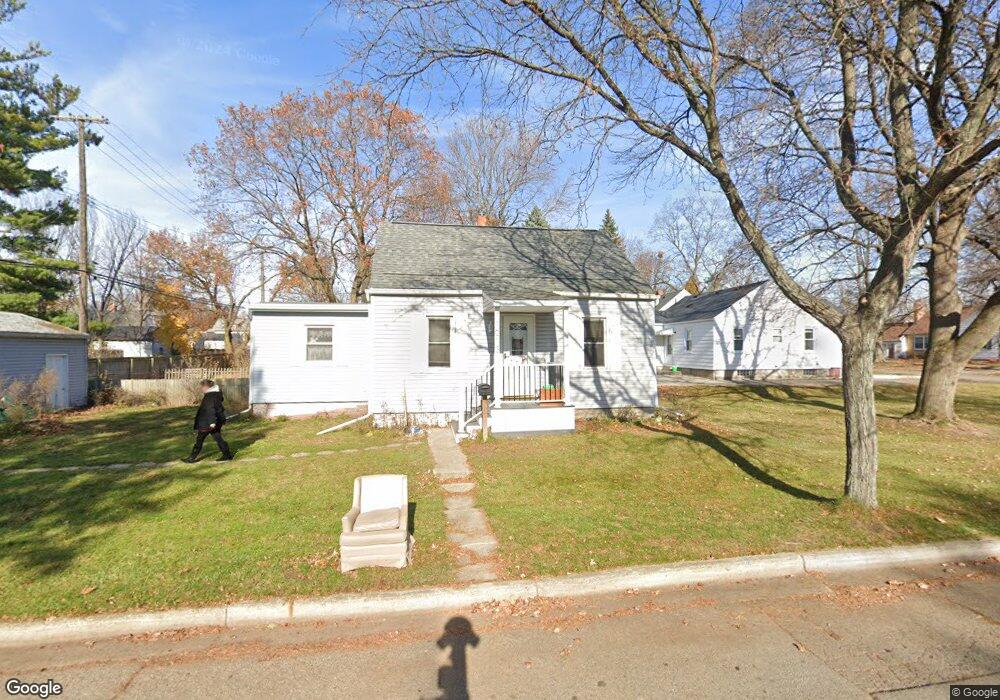
About This Home
This home is located at 1013 Riley St, Lansing, MI 48910 and is currently estimated at $147,223, approximately $165 per square foot. 1013 Riley St is a home located in Ingham County with nearby schools including Lyons Elementary School, Pattengill Academy, and Eastern High School.
Ownership History
We collect this data history from publicly available records. To have your information removed, we recommend requesting removal directly through your county’s website.
Purchase Details
Purchase Details
Purchase Details
Home Values in the Area
Average Home Value in this Area
Purchase History
We collect this data history from publicly available records. To have your information removed, we recommend requesting removal directly through your county’s website.
| Date | Buyer | Sale Price | Title Company |
|---|---|---|---|
| -- | None Listed On Document | ||
| $74,800 | Tri County Title Agency Llc | ||
| -- | -- |
Tax History
We collect this data history from publicly available records. To have your information removed, we recommend requesting removal directly through your county’s website.
| Year | Tax Paid | Tax Assessment Tax Assessment Total Assessment is a certain percentage of the fair market value that is determined by local assessors to be the total taxable value of land and additions on the property. | Land | Improvement |
|---|---|---|---|---|
| 2026 | $3,638 | $61,100 | $6,800 | $54,300 |
| 2025 | $3,034 | $59,600 | $8,400 | $51,200 |
| 2024 | $29 | $54,500 | $8,400 | $46,100 |
| 2023 | $3,321 | $46,900 | $8,400 | $38,500 |
| 2022 | $3,031 | $42,400 | $8,500 | $33,900 |
| 2021 | $2,961 | $38,900 | $7,900 | $31,000 |
| 2020 | $2,940 | $39,000 | $7,900 | $31,100 |
| 2019 | $2,842 | $35,800 | $7,900 | $27,900 |
| 2018 | $2,694 | $35,500 | $7,900 | $27,600 |
| 2017 | $2,593 | $35,500 | $7,900 | $27,600 |
| 2016 | $2,490 | $34,900 | $7,900 | $27,000 |
| 2015 | $2,490 | $34,000 | $15,887 | $18,113 |
| 2014 | $2,490 | $33,300 | $18,838 | $14,462 |
Map
- 2215 Alpha St
- 2036 Devonshire Ave
- 2100 Devonshire Ave
- 2115 Donora St
- 2017 Devonshire Ave
- 2409 Alpha St
- 2400 Devonshire Ave
- 2212 Lyons Ave
- 704 Kenwood Ave
- 1814 Sunnyside Ave
- 1735 Lyons Ave
- 2217 Grant St
- 2608 Clifton Ave
- 2310 Grant St
- 0 E Mount Hope Ave
- 554 Pacific Pkwy
- 1608 Sunnyside Ave
- 1601 Bailey St
- 531 Pacific Ave
- 609 S Park Blvd
- 2120 Alpha St
- 2116 Alpha St
- 2108 Alpha St
- 2119 S Pennsylvania Ave
- 2200 Alpha St
- 1001 Riley St
- 2117 S Pennsylvania Ave
- 2113 S Pennsylvania Ave
- 2100 Alpha St
- 2204 Alpha St
- 2109 S Pennsylvania Ave
- 2121 Alpha St
- 1101 Riley St
- 2105 S Pennsylvania Ave
- 2208 Alpha St
- 2115 Alpha St
- 2101 S Pennsylvania Ave
- 2109 Alpha St
- 2201 Alpha St
- 2212 Alpha St
Ask me questions while you tour the home.