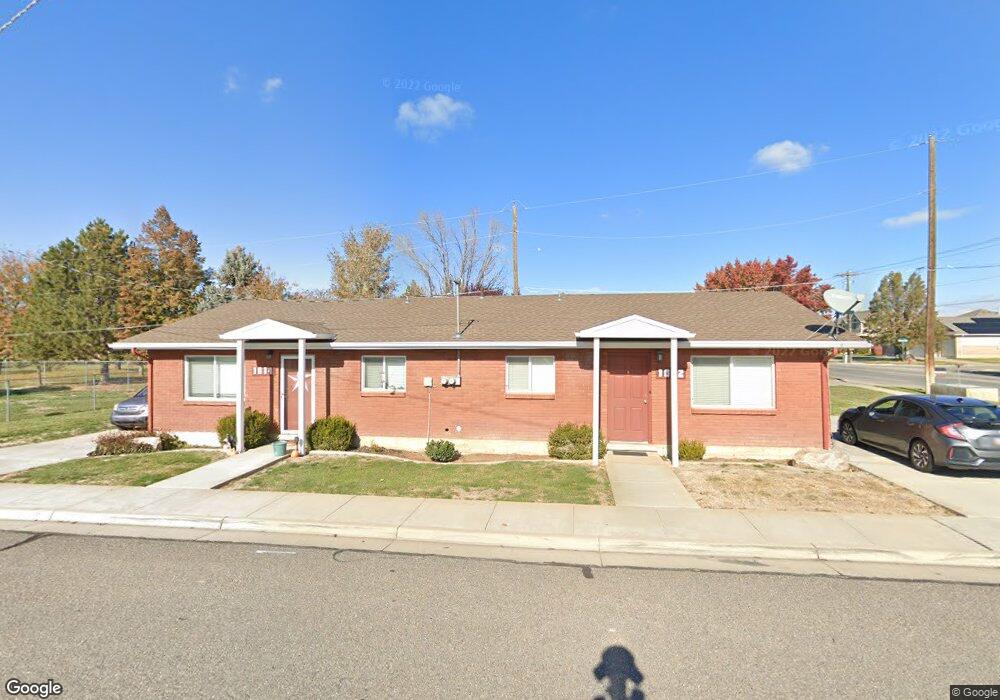
1014 Grants Ln Syracuse, UT 84075
Estimated Value: $438,000 - $454,011
4
Beds
2
Baths
1,722
Sq Ft
$259/Sq Ft
Est. Value
About This Home
This home is located at 1014 Grants Ln, Syracuse, UT 84075 and is currently estimated at $446,006, approximately $259 per square foot. 1014 Grants Ln is a home with nearby schools including Bluff Ridge Elementary, Legacy Junior High School, and Clearfield High School.
Ownership History
Date
Name
Owned For
Owner Type
Purchase Details
Closed on
Jan 24, 2012
Sold by
Christensen Mary Ellen and Christensen Mary Ellen T
Bought by
Christensen Mary Ellen
Current Estimated Value
Purchase Details
Closed on
Jul 20, 2011
Sold by
Thurgood Alan F and Thurgood Barbara T
Bought by
Templeton & Forbes Ii L L C
Purchase Details
Closed on
Aug 4, 2010
Sold by
Thurgood Elma and Christensen Mary Ellen
Bought by
Christensen Rick A and Christensen Mary
Create a Home Valuation Report for This Property
The Home Valuation Report is an in-depth analysis detailing your home's value as well as a comparison with similar homes in the area
Home Values in the Area
Average Home Value in this Area
Purchase History
| Date | Buyer | Sale Price | Title Company |
|---|---|---|---|
| Christensen Mary Ellen | -- | None Available | |
| Templeton & Forbes Ii L L C | -- | None Available | |
| Christensen Rick A | -- | None Available | |
| Thurgood Alan F | -- | None Available |
Source: Public Records
Tax History
| Year | Tax Paid | Tax Assessment Tax Assessment Total Assessment is a certain percentage of the fair market value that is determined by local assessors to be the total taxable value of land and additions on the property. | Land | Improvement |
|---|---|---|---|---|
| 2025 | $2,240 | $216,151 | $118,135 | $98,016 |
| 2024 | $1,093 | $212,299 | $91,589 | $120,710 |
| 2023 | $2,034 | $198,000 | $70,377 | $127,622 |
| 2022 | $2,160 | $381,000 | $135,414 | $245,586 |
| 2021 | $1,791 | $269,000 | $109,382 | $159,618 |
| 2020 | $1,595 | $232,000 | $98,326 | $133,674 |
| 2019 | $1,567 | $225,000 | $92,404 | $132,596 |
| 2018 | $1,390 | $198,000 | $91,216 | $106,784 |
| 2016 | $1,189 | $88,880 | $35,147 | $53,733 |
| 2015 | $1,161 | $82,610 | $30,306 | $52,304 |
| 2014 | $1,011 | $73,304 | $30,306 | $42,998 |
| 2013 | -- | $67,651 | $28,185 | $39,466 |
Source: Public Records
Map
Nearby Homes
- 1116 W 2325 S
- 1091 W 2175 S
- 1134 W 2275 S
- 1196 W 2325 S
- 2366 S 1230 W
- 2356 S 1230 W
- 1283 W 2375 S
- 1284 W 2375 S
- 2647 S 1175 W
- 1294 W 2375 S
- 921 W 2700 S
- 929 W 1920 S Unit A
- 961 1910 S
- 1168 W Tivoli Way
- 907 W 1840 S Unit C
- 1153 W 1875 S
- 2621 S 1580 W
- 2721 S Allison Way
- 2742 S Allison Way Unit 212
- 1643 W 2700 S Unit 216
Your Personal Tour Guide
Ask me questions while you tour the home.