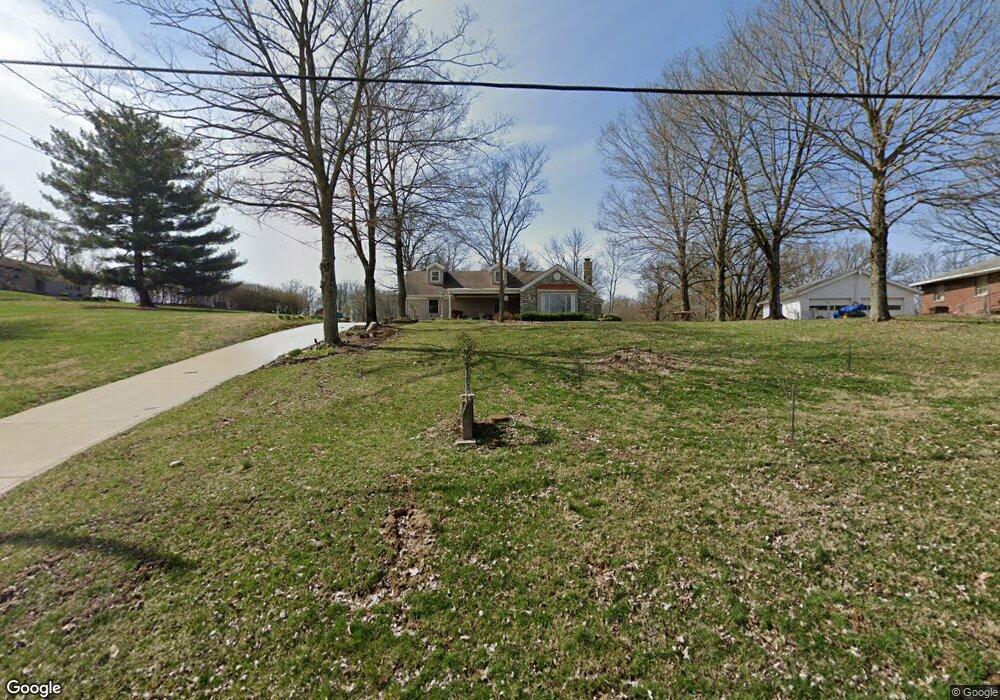
10159 Dugan Gap Rd North Bend, OH 45052
Estimated Value: $153,000 - $283,000
4
Beds
1
Bath
1,660
Sq Ft
$144/Sq Ft
Est. Value
About This Home
This home is located at 10159 Dugan Gap Rd, North Bend, OH 45052 and is currently estimated at $238,859, approximately $143 per square foot. 10159 Dugan Gap Rd is a home located in Hamilton County with nearby schools including Charles T. Young Elementary School, Taylor Middle School, and Taylor High School.
Ownership History
Date
Name
Owned For
Owner Type
Purchase Details
Closed on
Sep 10, 1999
Sold by
Bauer Timothy P
Bought by
Reid Jeffrey L and Reid Karen M
Current Estimated Value
Home Financials for this Owner
Home Financials are based on the most recent Mortgage that was taken out on this home.
Original Mortgage
$56,000
Outstanding Balance
$15,287
Interest Rate
7.72%
Estimated Equity
$223,572
Purchase Details
Closed on
Jun 9, 1999
Sold by
Reid Jeffrey L and Reid Karen M
Bought by
Bauer Timothy P
Home Financials for this Owner
Home Financials are based on the most recent Mortgage that was taken out on this home.
Original Mortgage
$67,000
Interest Rate
9.12%
Mortgage Type
Seller Take Back
Purchase Details
Closed on
Feb 28, 1995
Sold by
Johnston Norma J
Bought by
Reid Jeffrey L and Reid Karen M
Home Financials for this Owner
Home Financials are based on the most recent Mortgage that was taken out on this home.
Original Mortgage
$67,000
Interest Rate
9.21%
Create a Home Valuation Report for This Property
The Home Valuation Report is an in-depth analysis detailing your home's value as well as a comparison with similar homes in the area
Home Values in the Area
Average Home Value in this Area
Purchase History
| Date | Buyer | Sale Price | Title Company |
|---|---|---|---|
| Reid Jeffrey L | -- | Cambridge Land Title Agency | |
| Bauer Timothy P | $70,000 | -- | |
| Bauer Timothy P | $70,000 | -- | |
| Reid Jeffrey L | -- | -- |
Source: Public Records
Mortgage History
| Date | Status | Borrower | Loan Amount |
|---|---|---|---|
| Open | Reid Jeffrey L | $56,000 | |
| Previous Owner | Bauer Timothy P | $67,000 | |
| Previous Owner | Reid Jeffrey L | $67,000 | |
| Closed | Reid Jeffrey L | $10,000 |
Source: Public Records
Tax History
| Year | Tax Paid | Tax Assessment Tax Assessment Total Assessment is a certain percentage of the fair market value that is determined by local assessors to be the total taxable value of land and additions on the property. | Land | Improvement |
|---|---|---|---|---|
| 2025 | $3,008 | $56,837 | $18,414 | $38,423 |
| 2023 | $2,682 | $56,837 | $18,414 | $38,423 |
| 2022 | $2,566 | $42,487 | $16,737 | $25,750 |
| 2021 | $2,504 | $42,487 | $16,737 | $25,750 |
| 2020 | $2,517 | $42,487 | $16,737 | $25,750 |
| 2019 | $2,718 | $42,487 | $16,737 | $25,750 |
| 2018 | $2,614 | $42,487 | $16,737 | $25,750 |
| 2017 | $2,459 | $42,487 | $16,737 | $25,750 |
| 2016 | $2,517 | $45,098 | $20,094 | $25,004 |
| 2015 | $2,542 | $45,098 | $20,094 | $25,004 |
| 2014 | $2,569 | $45,098 | $20,094 | $25,004 |
| 2013 | $2,515 | $45,098 | $20,094 | $25,004 |
Source: Public Records
Map
Nearby Homes
- 2545 Cliff Rd
- 1540 Autumn Ridge Dr
- 1522 Autumn Ridge Dr
- 1759 Barons Cove
- 1226 Breckenridge Ln
- 9568 Mount Nebo Rd
- 1218 Breckenridge Ln
- 2313 John James Ct
- 1662 Bingham Cir
- 1697 Bingham Cir
- 1083 Breckenridge Ln
- 11225 U S 50
- 803 N Bend Rd
- TBD Do Not Use
- 101 E State Rd
- 633 Rivershore Dr
- 22 Skidmore St
- 104 W Laird St
- 2503 Rockcreek Ct
- 122 Spring St
- 10167 Dugan Gap Rd
- 10179 Dugan Gap Rd
- 10131 Dugan Gap Rd
- 10131 Dugan Gap Rd
- 10164 Dugan Gap Rd
- 10187 Dugan Gap Rd
- 10148 Dugan Gap Rd
- 10203 Dugan Gap Rd
- 10180 Dugan Gap Rd
- 1589 Cliff Rd
- 10198 Dugan Gap Rd
- 10213 Dugan Gap Rd
- 10212 Dugan Gap Rd
- 10221 Dugan Gap Rd
- 10220 Dugan Gap Rd
- 10233 Dugan Gap Rd
- 10228 Dugan Gap Rd
- 10236 Dugan Gap Rd
- 10248 Dugan Gap Rd
- 1691 Cliff Rd
Your Personal Tour Guide
Ask me questions while you tour the home.