Estimated Value: $131,355 - $189,000
Studio
--
Bath
1,496
Sq Ft
$111/Sq Ft
Est. Value
About This Home
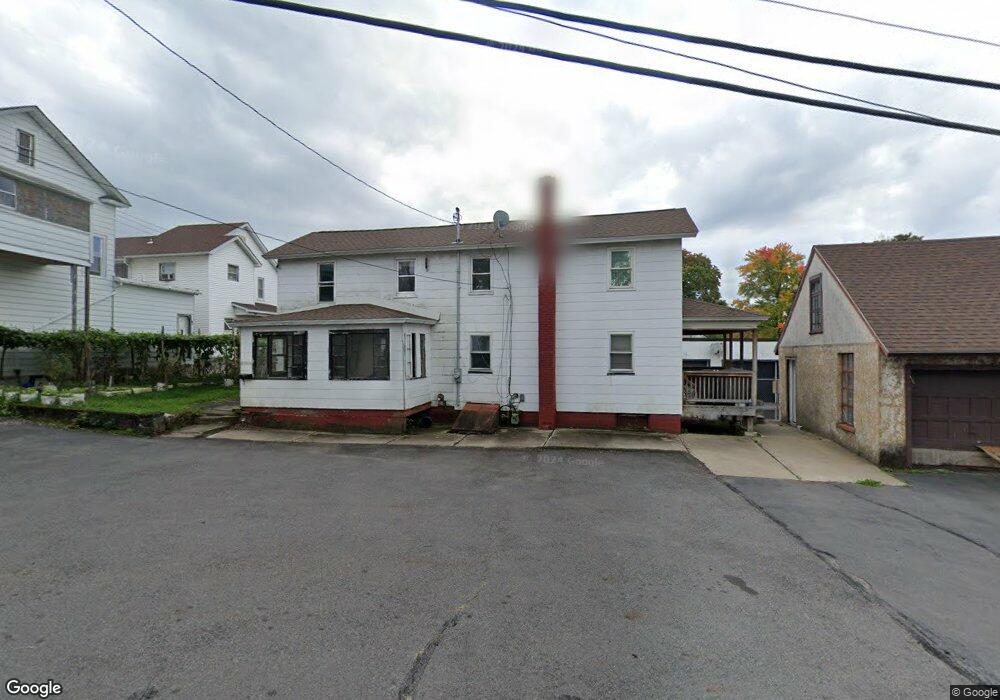
This home is located at 1019 Main St, Avoca, PA 18641 and is currently estimated at $165,839, approximately $110 per square foot. 1019 Main St is a home located in Luzerne County with nearby schools including Pittston City Intermediate Center, Pittston Area Middle School, and Pittston Area Senior High School.
Ownership History
Date
Name
Owned For
Owner Type
Purchase Details
Closed on
Apr 12, 2016
Sold by
Fannie Mae
Bought by
Lin Xia
Current Estimated Value
Purchase Details
Closed on
Dec 16, 2015
Sold by
Salerno Stacy
Bought by
Fannie Mae and Federal National Mortgage Association
Purchase Details
Closed on
May 16, 2005
Sold by
Day Gary L and Day Susan K
Bought by
Salerno Stacy
Home Financials for this Owner
Home Financials are based on the most recent Mortgage that was taken out on this home.
Original Mortgage
$40,000
Interest Rate
5.83%
Mortgage Type
New Conventional
Create a Home Valuation Report for This Property
The Home Valuation Report is an in-depth analysis detailing your home's value as well as a comparison with similar homes in the area
Home Values in the Area
Average Home Value in this Area
Purchase History
| Date | Buyer | Sale Price | Title Company |
|---|---|---|---|
| Lin Xia | $23,800 | None Available | |
| Fannie Mae | -- | Attorney | |
| Salerno Stacy | $40,000 | None Available | |
| Day Gary L | -- | None Available |
Source: Public Records
Mortgage History
| Date | Status | Borrower | Loan Amount |
|---|---|---|---|
| Previous Owner | Day Gary L | $40,000 |
Source: Public Records
Tax History
| Year | Tax Paid | Tax Assessment Tax Assessment Total Assessment is a certain percentage of the fair market value that is determined by local assessors to be the total taxable value of land and additions on the property. | Land | Improvement |
|---|---|---|---|---|
| 2026 | $1,949 | $74,700 | $18,800 | $55,900 |
| 2025 | $1,942 | $74,700 | $18,800 | $55,900 |
| 2024 | $1,942 | $74,700 | $18,800 | $55,900 |
| 2023 | $1,942 | $74,700 | $18,800 | $55,900 |
| 2022 | $1,928 | $74,700 | $18,800 | $55,900 |
| 2021 | $1,928 | $74,700 | $18,800 | $55,900 |
| 2020 | $1,864 | $74,700 | $18,800 | $55,900 |
| 2019 | $1,035 | $74,700 | $18,800 | $55,900 |
| 2018 | $1,775 | $74,700 | $18,800 | $55,900 |
| 2017 | $1,737 | $74,700 | $18,800 | $55,900 |
| 2016 | -- | $74,700 | $18,800 | $55,900 |
| 2015 | -- | $74,700 | $18,800 | $55,900 |
| 2014 | -- | $74,700 | $18,800 | $55,900 |
Source: Public Records
Map
Nearby Homes
- 1009 Grove St
- 1220 Main St
- 1309 South St
- 732 Main St
- 823 Mcalpine St
- 107 Stonecrest Dr
- 600 Center St
- 742 Donnelly St
- 616 Donnelly St
- 616 Rear Donnelly St
- 527 Minooka Ave
- 127 Broadhead St
- 120 Parkcrest Dr
- 1061 Springbrook Ave
- 398 N River St
- 122 W Morton St
- 1114 Springbrook Ave Unit REAR
- 323 Orchard St
- 1001 Quarry St
- 347 Orchard St
Your Personal Tour Guide
Ask me questions while you tour the home.