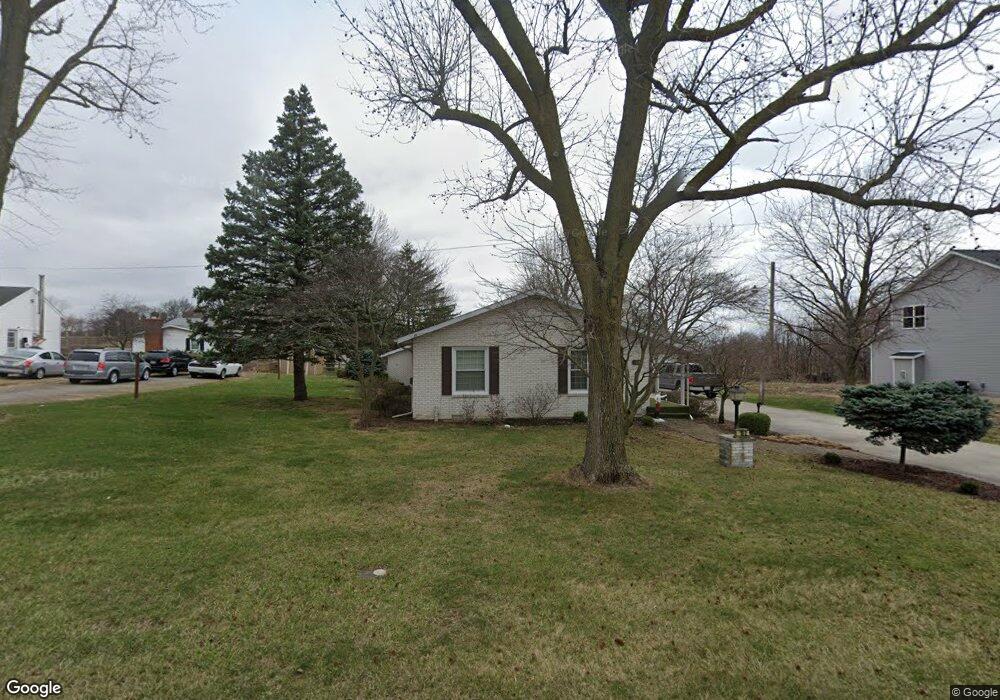
102 Rader Rd Mc Comb, OH 45858
McComb NeighborhoodEstimated Value: $215,169 - $284,000
3
Beds
3
Baths
2,181
Sq Ft
$112/Sq Ft
Est. Value
About This Home
This home is located at 102 Rader Rd, Mc Comb, OH 45858 and is currently estimated at $244,542, approximately $112 per square foot. 102 Rader Rd is a home located in Hancock County with nearby schools including McComb Elementary School, McComb Middle School, and Mccomb Local High School.
Create a Home Valuation Report for This Property
The Home Valuation Report is an in-depth analysis detailing your home's value as well as a comparison with similar homes in the area
Home Values in the Area
Average Home Value in this Area
Tax History
| Year | Tax Paid | Tax Assessment Tax Assessment Total Assessment is a certain percentage of the fair market value that is determined by local assessors to be the total taxable value of land and additions on the property. | Land | Improvement |
|---|---|---|---|---|
| 2024 | $1,558 | $55,670 | $6,110 | $49,560 |
| 2023 | $1,569 | $55,670 | $6,110 | $49,560 |
| 2022 | $1,933 | $55,670 | $6,110 | $49,560 |
| 2021 | $1,732 | $46,550 | $5,720 | $40,830 |
| 2020 | $1,472 | $46,550 | $5,720 | $40,830 |
| 2019 | $1,660 | $46,550 | $5,720 | $40,830 |
| 2018 | $1,342 | $40,500 | $4,970 | $35,530 |
| 2017 | $1,350 | $40,500 | $4,970 | $35,530 |
| 2016 | $1,295 | $40,500 | $4,970 | $35,530 |
| 2015 | $1,459 | $45,090 | $3,980 | $41,110 |
| 2014 | $1,478 | $45,090 | $3,980 | $41,110 |
| 2012 | $1,897 | $53,510 | $3,980 | $49,530 |
Source: Public Records
Map
Nearby Homes
- 223 Cherry St
- 128 S Liberty St
- 131 E South St
- 203 E Perrin Ave
- 257 S Main St
- 4609 Township Road 235
- 3470 Ohio 235
- 4134 County Road 203
- 3111 Township Road 93
- 7514 Township Road 95
- 4014 County Road 139
- 7780 Township Road 89
- 9894 Smokies Way
- 0 Rock Candy Rd Unit Lot 159
- 0 Rock Candy Rd Unit Lot 170
- 0 Rock Candy Rd Unit Lot 172 206819
- 0 Rock Candy Rd Unit Lot 162
- 0 Rock Candy Rd Unit Lot 171
- 0 Rock Candy Rd Unit Lot 168
- 0 Rock Candy Rd Or Bushwillow Dr Unit Lot 173
Your Personal Tour Guide
Ask me questions while you tour the home.