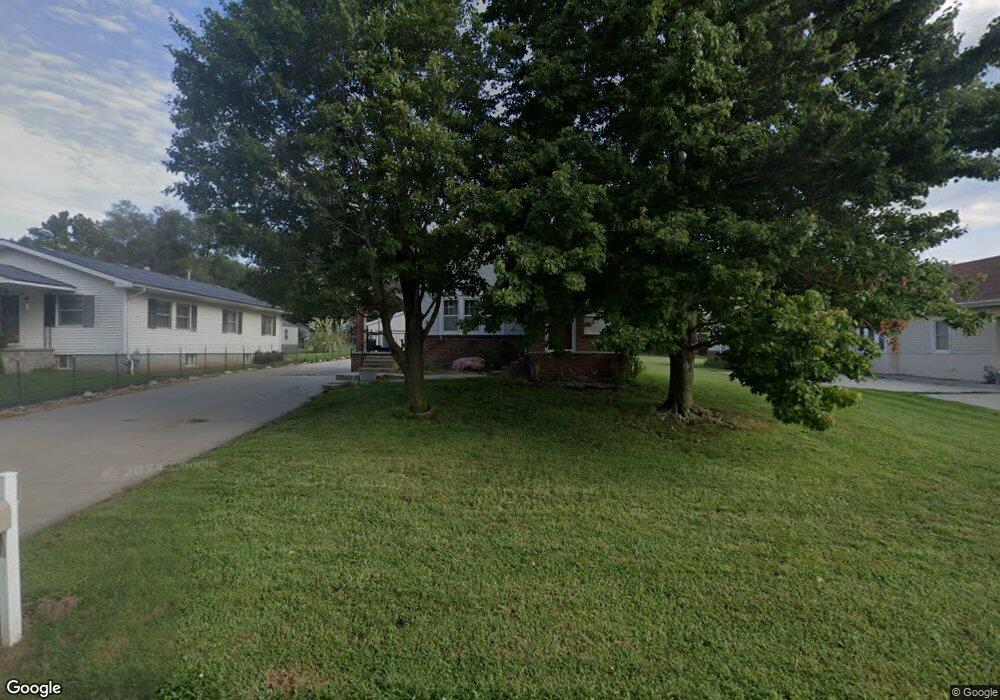
1022 E 12th St Falls City, NE 68355
Estimated Value: $91,000 - $142,000
4
Beds
3
Baths
1,860
Sq Ft
$67/Sq Ft
Est. Value
About This Home
This home is located at 1022 E 12th St, Falls City, NE 68355 and is currently estimated at $123,730, approximately $66 per square foot. 1022 E 12th St is a home located in Richardson County with nearby schools including Falls City North Elementary School, Falls City South Elementary School, and Falls City Middle School.
Ownership History
Date
Name
Owned For
Owner Type
Purchase Details
Closed on
Apr 27, 2023
Sold by
Campbell Nancy J
Bought by
Winters Christopher John
Current Estimated Value
Purchase Details
Closed on
Jul 11, 2008
Sold by
Campbell Jeffery R
Bought by
Campbell Nancy J
Purchase Details
Closed on
May 27, 2002
Sold by
Feldman Gary E
Bought by
Campbell Jeffery R and Campbell Nancy J
Purchase Details
Closed on
Oct 26, 2001
Sold by
Frederick Randall F and Frederick Brenda J
Bought by
Campbell Jeffery R and Campbell Nancy J
Create a Home Valuation Report for This Property
The Home Valuation Report is an in-depth analysis detailing your home's value as well as a comparison with similar homes in the area
Home Values in the Area
Average Home Value in this Area
Purchase History
| Date | Buyer | Sale Price | Title Company |
|---|---|---|---|
| Winters Christopher John | $70,000 | -- | |
| Campbell Nancy J | -- | -- | |
| Campbell Nancy J | -- | -- | |
| Campbell Jeffery R | -- | -- | |
| Campbell Jeffery R | $75,000 | -- |
Source: Public Records
Tax History
| Year | Tax Paid | Tax Assessment Tax Assessment Total Assessment is a certain percentage of the fair market value that is determined by local assessors to be the total taxable value of land and additions on the property. | Land | Improvement |
|---|---|---|---|---|
| 2025 | $831 | $76,762 | $4,163 | $72,599 |
| 2024 | $1,454 | $72,653 | $4,163 | $68,490 |
| 2023 | $1,454 | $88,638 | $4,163 | $84,475 |
| 2022 | $1,620 | $84,386 | $2,876 | $81,510 |
| 2021 | $1,734 | $92,560 | $2,876 | $89,684 |
| 2020 | $1,672 | $88,289 | $2,876 | $85,413 |
| 2019 | $1,651 | $85,801 | $2,876 | $82,925 |
| 2018 | $1,620 | $83,386 | $2,876 | $80,510 |
| 2017 | $1,623 | $83,386 | $2,876 | $80,510 |
| 2016 | $1,569 | $81,041 | $2,876 | $78,165 |
| 2015 | $1,575 | $81,041 | $2,876 | $78,165 |
| 2014 | $1,573 | $81,041 | $2,876 | $78,165 |
Source: Public Records
Map
Nearby Homes
Your Personal Tour Guide
Ask me questions while you tour the home.