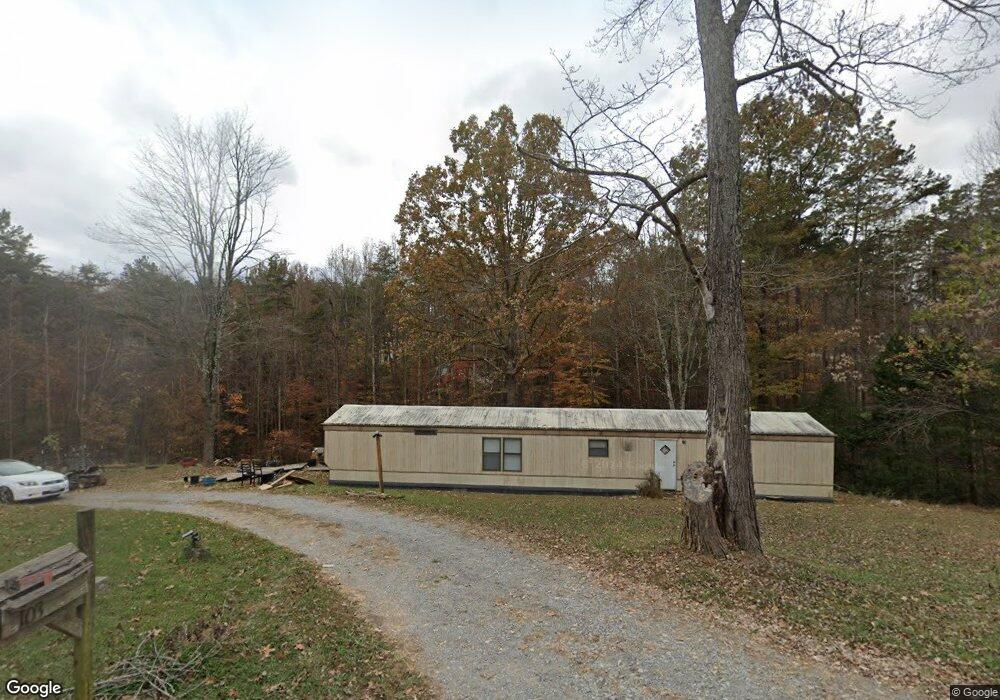
103 Dawnridge Ln Thaxton, VA 24174
Estimated Value: $113,595 - $166,000
2
Beds
2
Baths
980
Sq Ft
$145/Sq Ft
Est. Value
About This Home
This home is located at 103 Dawnridge Ln, Thaxton, VA 24174 and is currently estimated at $141,649, approximately $144 per square foot. 103 Dawnridge Ln is a home located in Bedford County with nearby schools including Montvale Elementary School, Liberty Middle School, and Liberty High School.
Ownership History
Date
Name
Owned For
Owner Type
Purchase Details
Closed on
May 19, 2022
Sold by
Dehaven Carl E
Bought by
Clarke Dwayne C and Clarke Oraleatha Thomas
Current Estimated Value
Purchase Details
Closed on
Sep 24, 2020
Sold by
The Bank Of Fincastle
Bought by
Dehaven Carl
Purchase Details
Closed on
Jul 29, 2019
Sold by
Pearl Peter M and Jayne Rhonda L
Bought by
The Bank Of Fincastle
Purchase Details
Closed on
Mar 28, 2008
Sold by
Jayne Eldon M
Bought by
Jayne Rhonda
Home Financials for this Owner
Home Financials are based on the most recent Mortgage that was taken out on this home.
Original Mortgage
$44,825
Interest Rate
6.3%
Mortgage Type
Credit Line Revolving
Purchase Details
Closed on
Apr 13, 2006
Sold by
Wright Thomas E and Wright Colleen P
Bought by
Jayne Eldon M
Home Financials for this Owner
Home Financials are based on the most recent Mortgage that was taken out on this home.
Original Mortgage
$44,625
Interest Rate
6.37%
Mortgage Type
Credit Line Revolving
Create a Home Valuation Report for This Property
The Home Valuation Report is an in-depth analysis detailing your home's value as well as a comparison with similar homes in the area
Purchase History
| Date | Buyer | Sale Price | Title Company |
|---|---|---|---|
| Clarke Dwayne C | $21,000 | None Listed On Document | |
| Dehaven Carl | $16,500 | Advantage Title & Closing | |
| The Bank Of Fincastle | $34,600 | None Available | |
| Jayne Rhonda | -- | None Available | |
| Jayne Eldon M | $59,950 | None Available |
Source: Public Records
Mortgage History
| Date | Status | Borrower | Loan Amount |
|---|---|---|---|
| Previous Owner | Jayne Rhonda | $44,825 | |
| Previous Owner | Jayne Eldon M | $44,625 |
Source: Public Records
Tax History
| Year | Tax Paid | Tax Assessment Tax Assessment Total Assessment is a certain percentage of the fair market value that is determined by local assessors to be the total taxable value of land and additions on the property. | Land | Improvement |
|---|---|---|---|---|
| 2025 | $223 | $54,400 | $30,000 | $24,400 |
| 2024 | $223 | $54,400 | $30,000 | $24,400 |
| 2023 | $223 | $27,200 | $0 | $0 |
| 2022 | $255 | $25,500 | $0 | $0 |
| 2021 | $255 | $51,000 | $20,000 | $31,000 |
| 2020 | $255 | $51,000 | $20,000 | $31,000 |
| 2019 | $255 | $51,000 | $20,000 | $31,000 |
| 2018 | $260 | $50,000 | $20,000 | $30,000 |
| 2017 | $260 | $50,000 | $20,000 | $30,000 |
| 2016 | $260 | $50,000 | $20,000 | $30,000 |
| 2015 | $260 | $50,000 | $20,000 | $30,000 |
| 2014 | -- | $52,800 | $20,000 | $32,800 |
Source: Public Records
Map
Nearby Homes
- 2579 Quarles Rd
- 214 Oakridge Dr
- 108 Cherokee Ln
- 105 Cherokee Ln
- 108 Rolling Meadow Dr
- 326 Robincrest Cir
- 8727 W Lynchburg Salem Turnpike
- 2352 Union Church Rd
- 2781 Johnson School Rd
- LOT 5 Pilot Mountain Rd
- 2068 Pilot Mountain Rd
- 1572 Ivy Branch Dr
- 9 Oak Dr
- 104 Bentwood Dr
- 4797 Rocky Ford Rd
- 3382 Rocky Ford Rd
- 1072 Garner Rd
- 1075 Breezy Hill Rd
- Lot 22 Woodshire Dr
- 1374 Moccasin Rd
- 105 Dawnridge Ln
- 104 Dawnridge Ln
- 102 Dawnridge Ln
- 300 Fairdale Dr
- 100 Dawnridge Ln
- 106 Dawnridge Ln
- 301 Fairdale Dr
- 302 Fairdale Dr
- 303 Fairdale Dr
- 107 Dawnridge Ln
- 108 Dawnridge Ln
- 201 Fairdale Dr
- 201 Fairdale Dr
- 1778 Pendleton Rd
- 304 Fairdale Dr
- 200 Fairdale Dr
- 101 Shadelawn Dr
- 110 Dawnridge Ln
- 400 Fairdale Dr
- 100 Shadelawn Dr
Your Personal Tour Guide
Ask me questions while you tour the home.