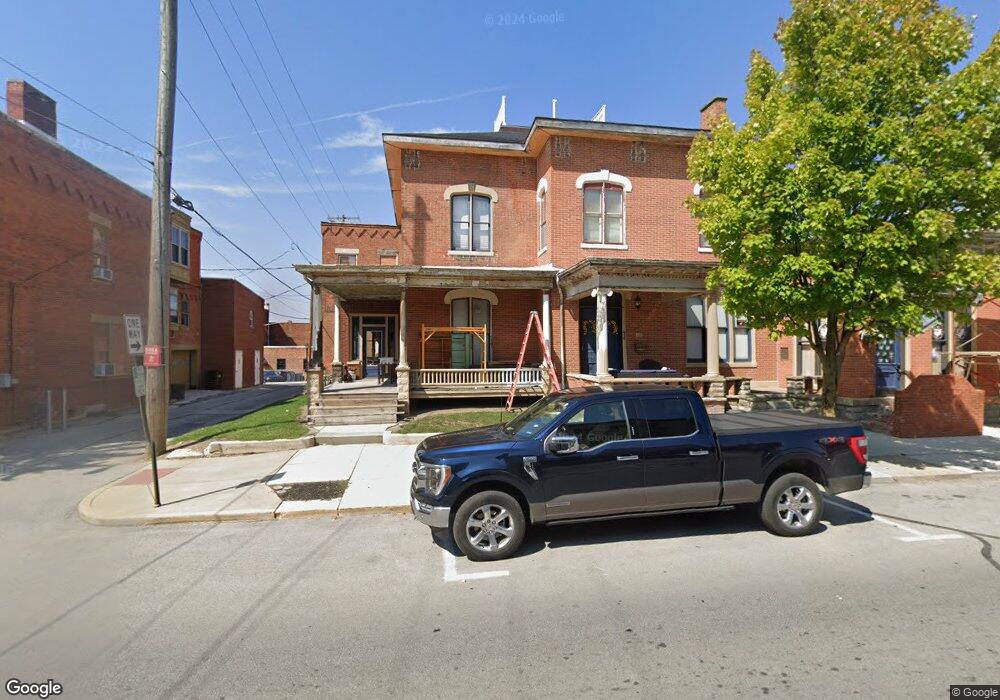
103 E Perry St Tiffin, OH 44883
Estimated Value: $68,000 - $112,000
5
Beds
2
Baths
2,686
Sq Ft
$35/Sq Ft
Est. Value
About This Home
This home is located at 103 E Perry St, Tiffin, OH 44883 and is currently estimated at $92,841, approximately $34 per square foot. 103 E Perry St is a home with nearby schools including Columbian High School, Calvert High School, and Calvert Catholic Elementary School.
Ownership History
Date
Name
Owned For
Owner Type
Purchase Details
Closed on
Sep 30, 2021
Sold by
Aldrich Melvin
Bought by
Steinmetz Steven J and Steinmetz Katina M
Current Estimated Value
Purchase Details
Closed on
Mar 29, 2018
Sold by
Mdr Investments Unlimited Llc
Bought by
Steinmetz Steven J and Steinmetz Katina M
Purchase Details
Closed on
Jan 9, 2003
Sold by
Runion Eric A
Bought by
Mdr Investments Unlimited
Purchase Details
Closed on
Aug 27, 1999
Sold by
Nielsen Marcus E
Bought by
Runion Eric A
Purchase Details
Closed on
Jun 5, 1998
Sold by
Talbert Beverly R
Bought by
Nielsen Marcus E
Purchase Details
Closed on
Feb 7, 1995
Sold by
Talbert Bonford R
Bought by
Talbert Beverly R
Purchase Details
Closed on
Jul 1, 1988
Create a Home Valuation Report for This Property
The Home Valuation Report is an in-depth analysis detailing your home's value as well as a comparison with similar homes in the area
Home Values in the Area
Average Home Value in this Area
Purchase History
| Date | Buyer | Sale Price | Title Company |
|---|---|---|---|
| Steinmetz Steven J | -- | None Available | |
| Steinmetz Steven J | $50,000 | None Available | |
| Steinmetz Steven J | -- | Schwartz Randall C | |
| Steinmetz Steven J | $50,000 | None Available | |
| Mdr Investments Unlimited | -- | -- | |
| Runion Eric A | $140,000 | -- | |
| Nielsen Marcus E | $120,000 | -- | |
| Talbert Beverly R | -- | -- | |
| -- | $25,000 | -- |
Source: Public Records
Mortgage History
| Date | Status | Borrower | Loan Amount |
|---|---|---|---|
| Closed | Steinmetz Steven J | $0 |
Source: Public Records
Tax History
| Year | Tax Paid | Tax Assessment Tax Assessment Total Assessment is a certain percentage of the fair market value that is determined by local assessors to be the total taxable value of land and additions on the property. | Land | Improvement |
|---|---|---|---|---|
| 2025 | $1,038 | $15,410 | $3,150 | $12,260 |
| 2024 | $1,122 | $15,410 | $3,150 | $12,260 |
| 2023 | $0 | $15,410 | $3,150 | $12,260 |
| 2022 | $1,024 | $11,700 | $2,670 | $9,030 |
| 2021 | $697 | $11,700 | $2,670 | $9,030 |
| 2020 | $1,089 | $11,708 | $2,674 | $9,034 |
| 2019 | $864 | $15,337 | $6,384 | $8,953 |
| 2018 | $763 | $15,337 | $6,384 | $8,953 |
| 2017 | $712 | $15,337 | $6,384 | $8,953 |
| 2016 | $1,032 | $14,379 | $5,891 | $8,488 |
| 2015 | $2,993 | $14,379 | $5,891 | $8,488 |
| 2014 | $1,548 | $14,379 | $5,891 | $8,488 |
| 2013 | $1,512 | $14,050 | $5,891 | $8,159 |
Source: Public Records
Map
Nearby Homes
- 99 E Perry St
- 102 E Perry St
- 47 S Washington St
- 42 Jefferson St
- 23 Court St
- 27 Court St
- 25 S Washington St
- 62 S Washington St
- 79 S Washington St
- 79 S Washington St
- 23 S Washington St
- 70 S Washington St
- 6668 N Washington St
- 10 Riverside Dr
- 66 S Washington St
- 93 S Washington St
- 84 S Washington St
- 147 E Perry St
- 92 S Washington St Unit D
- 92 S Washington St
Your Personal Tour Guide
Ask me questions while you tour the home.